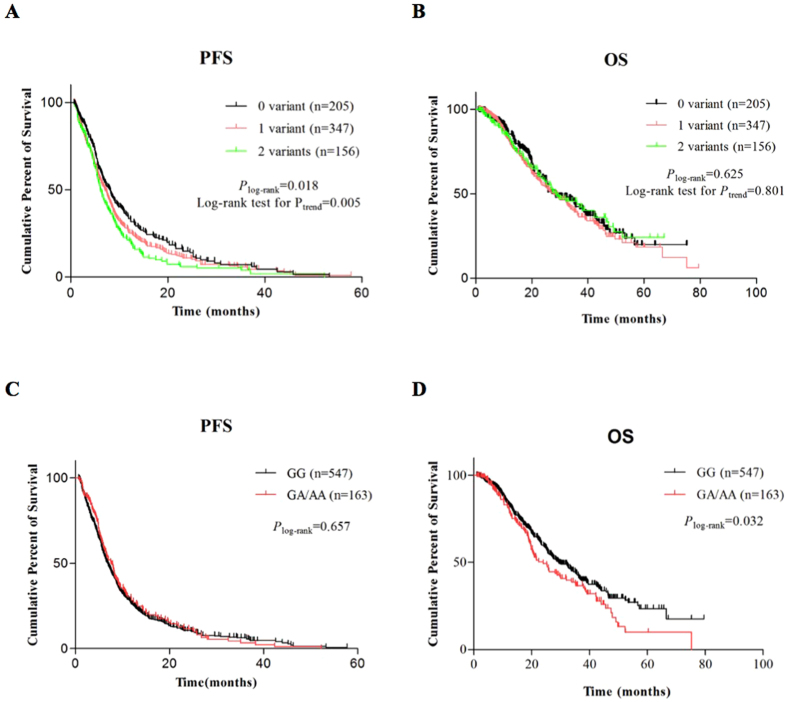
Figure 1.
Kaplan-Meier survival curves for non-small cell lung cancer (NSCLC) patients by risk genotypes. (A) Progression-free survival (PFS) curves for a score of 0, 1, 2 for the number of risk genotypes (NRGs, i.e. rs3212924 AG/GG, rs2229090 GG); (B) Overall survival (OS) curve for a score of 0, 1, 2 for the NRGs (i.e. rs3212924 AG/GG, rs2229090 GG); (C) PFS curves for ERCC4 rs1799798 risk genotypes (GA/AA vs. GG); (D) OS curves for ERCC4 rs1799798 risk genotypes (GA/AA vs. GG).

