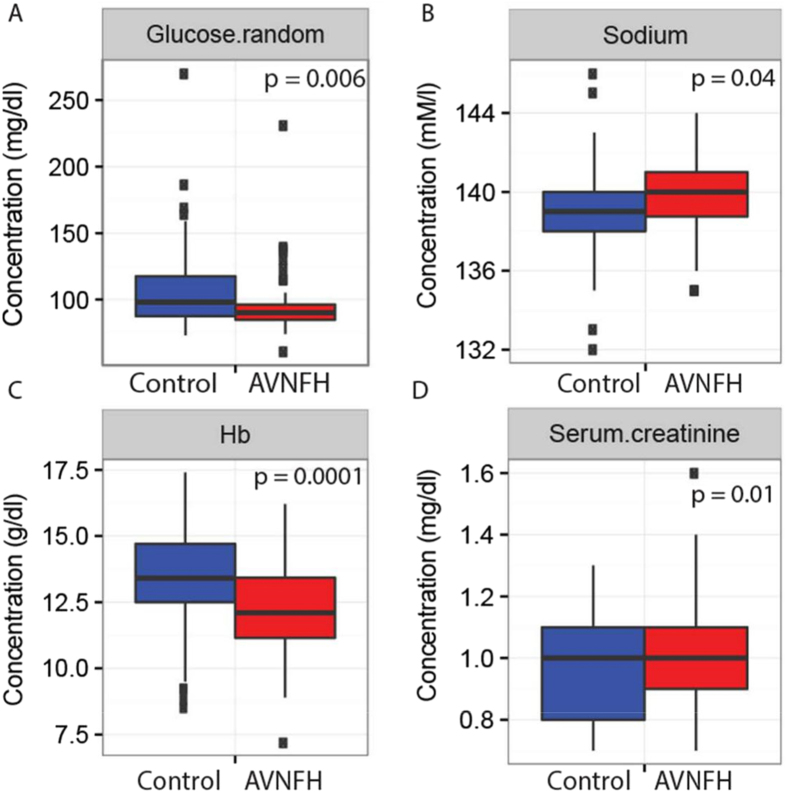
Figure 2.
Box plots showing significantly altered levels of clinical analytes in blood samples from AVNFH patients compared to control subjects. X-axis describes the diagnostic groups and Y-axis represents concentrations of the analyte. (A) Random glucose, (B) Sodium, (C) Hemoglobin, and (D) Serum creatinine. In all cases p values were calculated using Students T-test. One outlier AVNFH sample having significantly lower values for all the clinical parameters was removed from the analysis.

