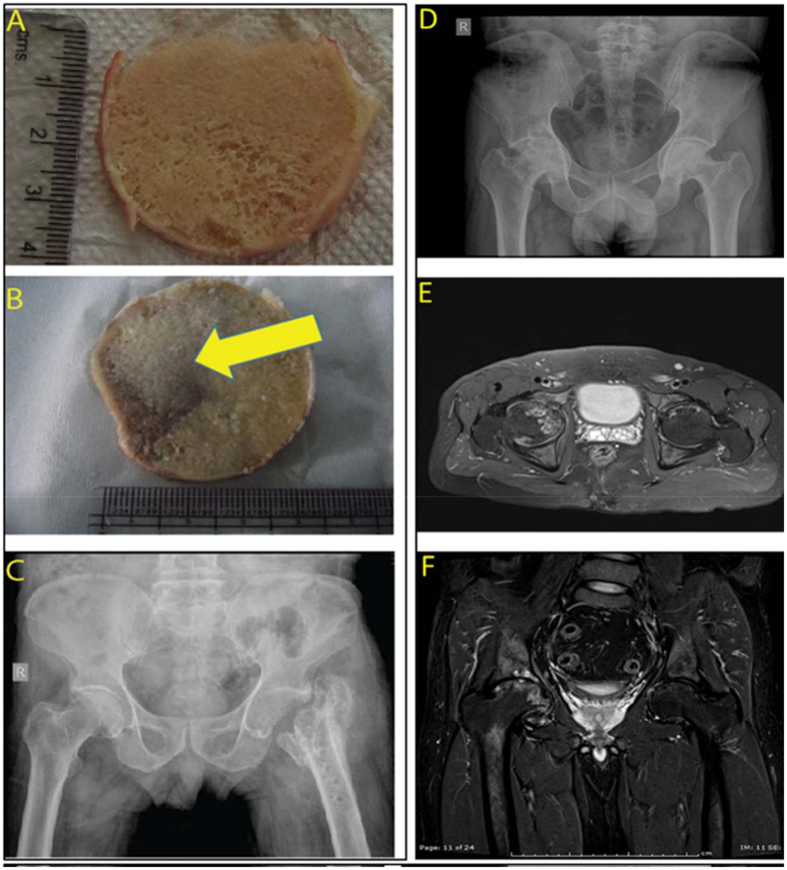
Figure 4.
(A) Overview of representative AVNFH and control bone samples used in the study. (A) A representative gross image of a trabecular cross section of control bone. (B) Same as in A, but for AVNFH bone. Region affected by AVN is shown by the yellow arrow. (C) X ray image of the pelvic region from a control individual with fractured femur (D) X ray image of the pelvic region of a patient with Avascular Necrosis of the Femoral Head (AVNFH). (E,F) Magnetic Resonance Image (MRI of the pelvic region of a patient with AVNFH.

