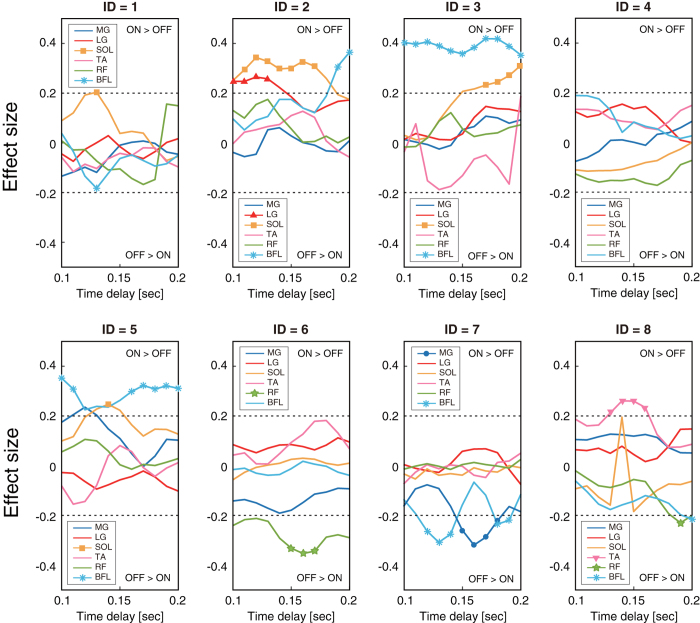
Figure 4.
The effect sizes for the comparison of between on and off periods with a time lag ranging from 0.1 to 0.2 s for all muscles of every participant. Negative value of effect size represents the larger during off-periods compared with that in on-periods, which accords with the intermittent control theory. Horizontal axis represents time lag and vertical axis represents effect size. Marks on each line (●, ▲, ■, ▼, ★, and *□ are for MG, LG, SOL, TA, RF, and BFL, respectively) show significant differences between on- and off- periods. Horizontal dashed lines show the absolute value of the effect size of 0.2, which we consider to be a statistically meaningful value.

