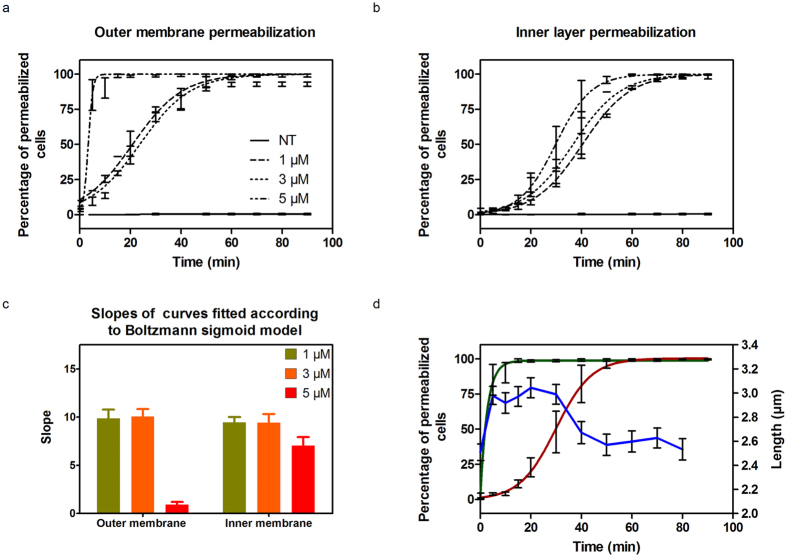
Figure 5.
diNn induces outer and inner membrane permeabilization in addition to a decrease of bacterial cell length. Time lapse studies were conducted for 5 hours at 37 °C in CaMHB agarose pad supplemented with NPN, PI, and diNn when needed. Fluorescence and wide field images were analyzed in order to evaluate outer and inner membrane permeabilization and length of the cells. An increase in fluorescence indicates membrane permeabilization. Kinetics of the (a) outer and (b) inner bacterial membrane permeabilization in the presence of increasing concentrations of diNn. (c) Slopes of the sigmoidal curves fitting of outer and inner bacterial membrane permeabilization. The rate of permeabilization process is inversely proportional to the slope. According to one way ANOVA’s test and Tukeys comparison test, outer membrane permeabilization at 5 µM was significantly different (p < 0.001) than permeabilization at 1 µM and 3 µM whereas no statistically significant difference was observed in inner membrane permeabilization between the three concentrations (N = 3, values are mean ± SEM). (d) Outer (green) and inner (red) membrane permeabilization and bacterial length (blue) evaluation as a function of time and in the presence of diNn at 5 µM (N = 3).

