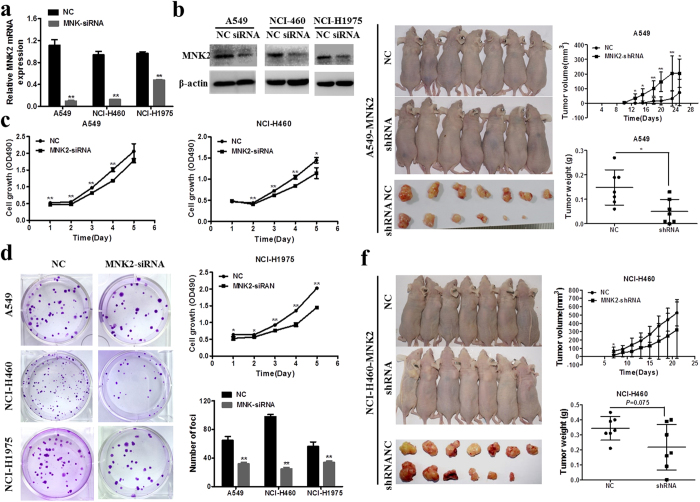
Figure 2.
Silencing of MNK2 reduced cell and tumor growth. (a,b) Expression of MNK2 was silenced by siRNA. The mRNA and protein levels of MNK2 were detected by qRT-PCR and WB, respectively (**P < 0.01). siRNA-NC was used as a vector control. Images presented in this panel were cropped from different parts of the same gel, or from different gels. The full-length gels are presented in the Supplementary Fig. S1. (c) Cell proliferation rates of MNK2-silencing cells (siRNA-MNK2) and negative control cells were evaluated by CCK-8 assay. Results were expressed as mean ± SD of three independent experiments (*P < 0.05, **P < 0.01). (d) Foci formation assay was performed to compare the frequency of foci formation between siRNA-MNK2 and negative control cells. Results were expressed as mean ± SD of three independent experiments (**P < 0.01). (e) For A549 cell groups, tumor number and size of the shRNA-MNK2 group (n = 6) were less and smaller than those of the negative control group (n = 7). Detected tumor growth was significantly different (*P < 0.05, **P < 0.01). Tumor weights between each group were also compared (*P < 0.05). (f) For NCI-H460 cell groups, tumor number and size of the shRNA-MNK2 group (n = 6) were less and smaller than those of the negative control group (n = 7). However, no significant difference was detected for tumor growth (P > 0.05) except on the 7th day (*P < 0.05). Tumor weights between the shRNA-MNK2 group and negative control group were also compared (P = 0.075).

