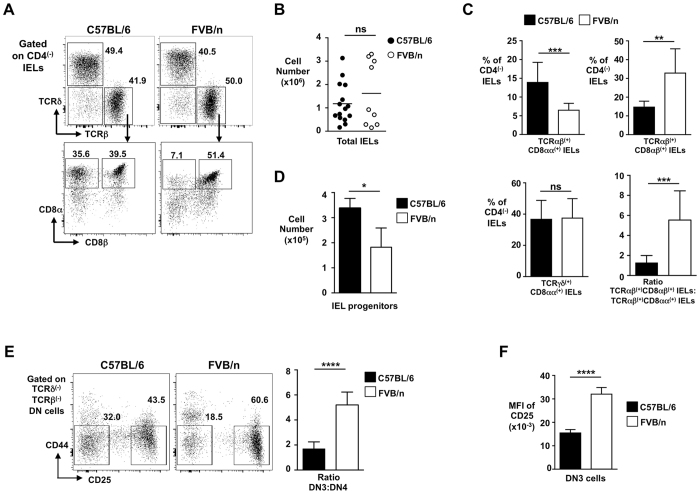
Figure 1.
Reduced TCRαβ(+)CD8αα(+) IELs in FVB/n mice. (A) Representative flow cytometry plots (from n > 6) of IEL populations (TCRαβ(+)CD8αα(+) and TCRαβ(+)CD8αβ(+) IELs) from small intestine of C57BL/6 and FVB/n mice. Gating strategy and percentages of cells are indicated. (B) Total cell yield for IEL-preps from C57BL/6 and FVB/n mice. (C) Summary bar graphs (n > 6) of percentages (of total CD4(−) IELs) of TCRαβ(+)CD8αα(+), TCRαβ(+)CD8αβ(+) and TCRγδ(+)CD8αα(+) IELs from C57BL/6 and FVB/n mice. Right-hand bottom graph shows ratio of conventional TCRαβ(+)CD8αβ(+) to unconventional TCRαβ(+)CD8αα(+) IELs. (D) Bar graph showing total cell number of thymic IEL progenitors from C57BL/6 and FVB/n mice gated as CD4(lo)CD8(lo)TCRδ(−)TCRβ(+)CD5(hi)PD-1(+)CD69(+)CD122(+) cells (n > 5). (E) Representative flow cytometry plots (from n > 10) of thymic DN3 and DN4 subsets (cells shown gated as CD4(−)CD8(−)TCRβ(−)TCRδ(−)) from C57BL/6 and FVB/n mice, with summary bar chart for the DN3 to DN4 ratio in both strains. (F) Summary bar chart of mean fluorescence intensity (MFI) of surface CD25 on DN3 thymocytes from each strain of mice.

