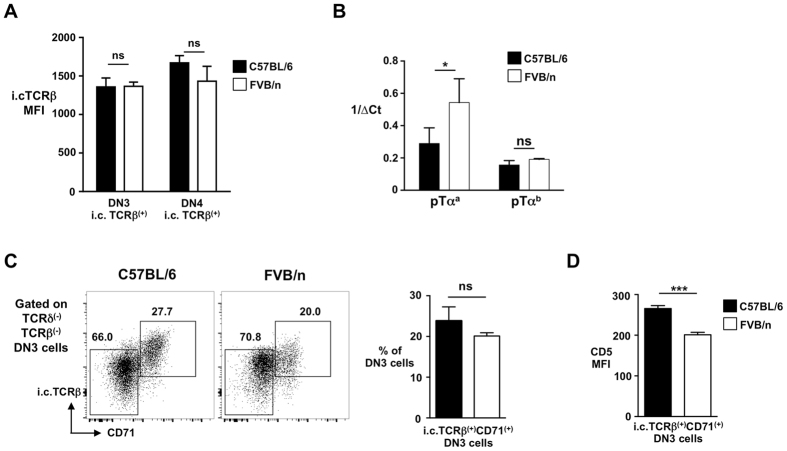
Figure 2.
Weak preTCR signal strength in FVB/n mice underlies inefficient β-selection. (A) Summary bar graph of i.c.TCRβ MFI in DN3 and DN4 thymocytes from C57BL/6 and FVB/n mice. (B) Relative level of pTαa and pTαb transcripts expressed by the DN3 thymocytes from C57BL/6 and FVB/n mice. ΔCt corresponds to normalised CT value of reaction according to the reference gene GAPDH. *p < 0.05, ns is for not significant. (C) Representative flow cytometry profiles (left) showing i.c.TCRβ and CD71 on DN3 cells from C57BL/6 and FVB/n mice. Percentages of cells are indicated. Summary bar chart (right) shows percentage of DN3 cells that are i.c.TCRβ CD71(+). (D) CD5 MFI levels on CD71(+) β-selected DN3 thymocytes (i.c.TCRβ(+)CD71(+)) from C57BL/6 and FVB/n mice. ****p < 0.0001, ***p < 0.001, **p < 0.01, ns is for not significant.

