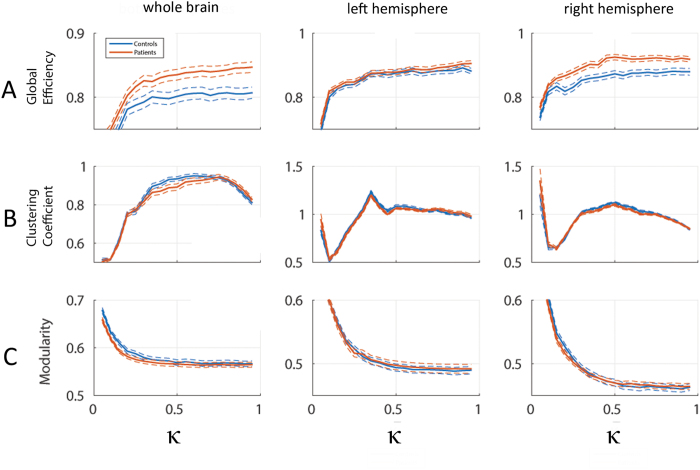
Figure 2.
Global graph parameters for healthy controls (blue) and Tourette patients (red) according to hemisphere sides (whole brain, left and right hemispheres). Solid and dashed lines represent group means and standard errors, respectively. Efficiency (A) and clustering coefficient (B) were normalised with respect to the average of 150 (per subject and parameter) instances of strength- and degree-preserving random reference networks. Clustering has been transformed as for better visualization. Non-normalized values of Modularity (C) are shown.

