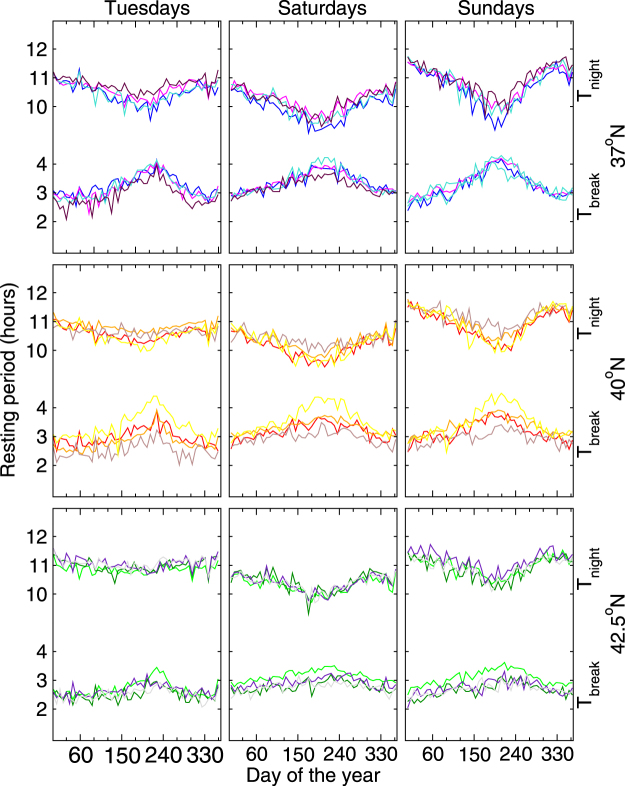
Figure 2.
Periods of low calling activity or of resting: T break and T night for 12 different cities across 2007 for 3 different days of the week (Tuesdays, Saturdays, and Sundays in the left, central, and right column, respectively). Four cities are located in each one of the three different latitudinal bands (top) 37°N,(middle) 40°N, and (bottom) 42.5°N. For cities lying around 37°N, the color line associated with their times series are blue, magenta, turquoise and maroon; for cities at 40°N, the colors are red, orange, brown and yellow; and for cities around 42.5°N the colors are green, dark green, indigo and gray. Inside each one of the nine plots, the annual behavior of T break (bottom lines) and T night (upper lines) are shown, for the four different cities located at each band. On every plot, T break and T night show an opposite seasonal variations, with dynamics that appear to counterbalance each other, particularly on Sundays.

