Figure 3.
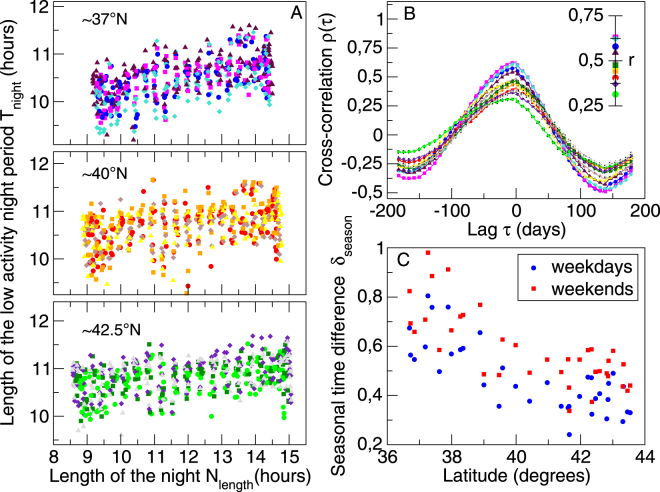
Relation between the period of low activity T night and the length of the night N length: (Panel A) Scatter plots of T night against N length for 12 cities located at one of the three different latitudinal bands 37°N (blue, magenta, turquoise and maroon), 40°N (red, orange, brown and yellow), and 42.5N (green, dark green, indigo and gray), such that in each set the points represent the pairs (N length, T length) across the 365 days of 2007 (only the Tuesdays, Saturdays and Sundays are shown). (Panel B) The normalized cross-correlation r between T night and N length as a function of the time lag τ. Across the year T night and N length time-series are synchronized, as their cross-correlation ρ(τ) reaches its maximum for the time lag τ = 0, thus T night and N length are in phase and as depicted in the inset, the correlation between them is for all cases very high, i.e. r > 0.3, p < 0.001. The time-series were normalized (see Methods) and all the days of the week were taken into account. (Panel C) Latitudinal dependence of the net change δ season between at winter solstice (maximum) and at summer solstice (minimum). For cities in the south, this difference is larger than for the cities in the north. Each point corresponds to one of the 36 studied cities calculated as averages of for weekdays from Mondays to Thursdays (blue) and for weekends from Fridays to Sundays (red).

