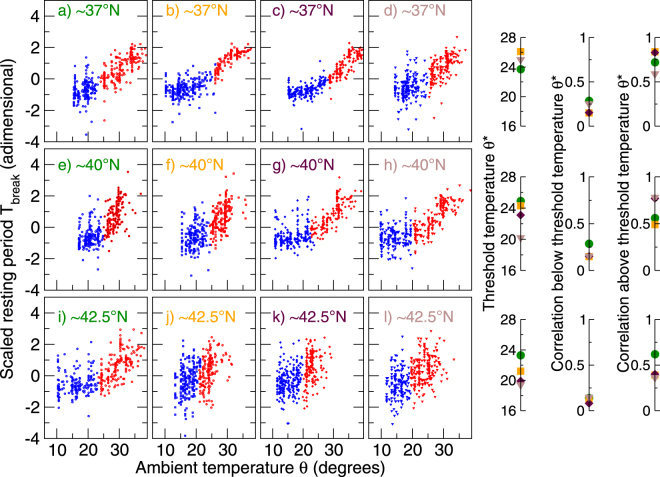
Figure 4.
Relation between the afternoon break period T break and the maximum daily temperature θ, for 12 different cities located at one of the three different latitudinal bands: (top) 37°N, (middle) 40°N, and (bottom) 42.5°N. (Left panels) For each city (a to l), a point represents a pair () for one of the 365 days of 2007. The scatter plots show that T break behaves differently for different temperature ranges (blue points correspond to “cold” or “cool” days and red points to “warm” or“hot” days), separated by a threshold temperature θ* below which T break seems to stay more or less constant and above it increasing with temperature. (Right panel) For each of the three latitudinal bands variabilities of: the threshold temperature θ* (first column) and the correlation r between T break and θ when the temperature is below (second column) and above (third column) the threshold temperature θ*. (The color labeling (green, orange, indigo or brown) of cities in each latitudinal band is the same in both panels). The correlation are calculated using points above the temperature thresholds, turning out to be strong in all cases with values >99%. For temperatures below the threshold, the correlation is weak with p-values in general greater than 0.05. The points were clustered as below (blue) and above (red) the threshold by using a spectral clustering technique based on the Shi-Malik algorithm55, 56.

