Figure 5.
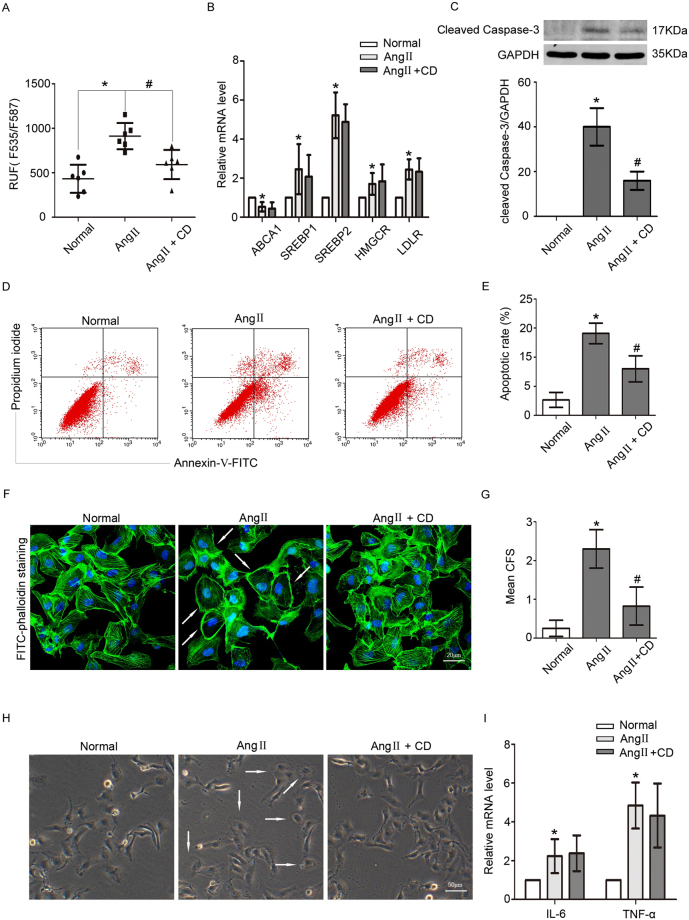
CD ameliorated Ang II-induced cholesterol accumulation and injury in podocytes. Podocytes were pretreated with CD and then stimulated with Ang II. (A) Quantitative analysis of the fluorescence intensity in different groups, indicating that CD reduced Ang II-induced cholesterol accumulation. n = 6, *p < 0.05 vs. the normal group, # p < 0.05 vs. the Ang II group. (B) The histogram shows the changes in the relative mRNA levels of the cholesterol metabolism-related factors ABCA1, SREBP1, SREBP2, HMGCR and LDLR in three different groups, demonstrating that CD did not affect the Ang II-mediated expression levels. n = 3, *p < 0.05 vs. the normal group. (C) Representative Western blot and quantitative analysis of Cleaved Caspase-3 in different groups. n = 3, *p < 0.05 vs. the normal group, # p < 0.05 vs. the Ang II group. For clarity lanes were cropped from the same gel. Full-length blots are presented in Fig. S5. (D) Flow cytometry analysis of podocyte apoptosis in different groups. (E) Quantitative analysis of the podocyte apoptotic rate in different groups, demonstrating that Ang II induced podocyte apoptosis, but CD pretreatment lowered the apoptosis rate. n = 3, *p < 0.05 vs. the normal group, # p < 0.05 vs. the Ang II group. (F) Representative FITC-phalloidin staining of the podocyte actin cytoskeleton in different groups (magnification ×400). Scale bar, 20 μm. (G) Quantitative analysis of CFS (n = 100). n = 3, *p < 0.05 vs. the normal group, # p < 0.05 vs. the Ang II group. Ang II induced podocyte cytoskeleton reorganization, which was improved by CD pretreatment. (H) Representative spreading images of podocytes in different groups (original magnification ×200). Scale bar, 50 μm. Ang II inhibited podocyte spreading, but CD pretreatment promoted podocyte spreading. (I) The histogram shows the changes in the relative mRNA levels of IL-6 and TNF α. n = 3, *p < 0.05 vs. the normal group.

