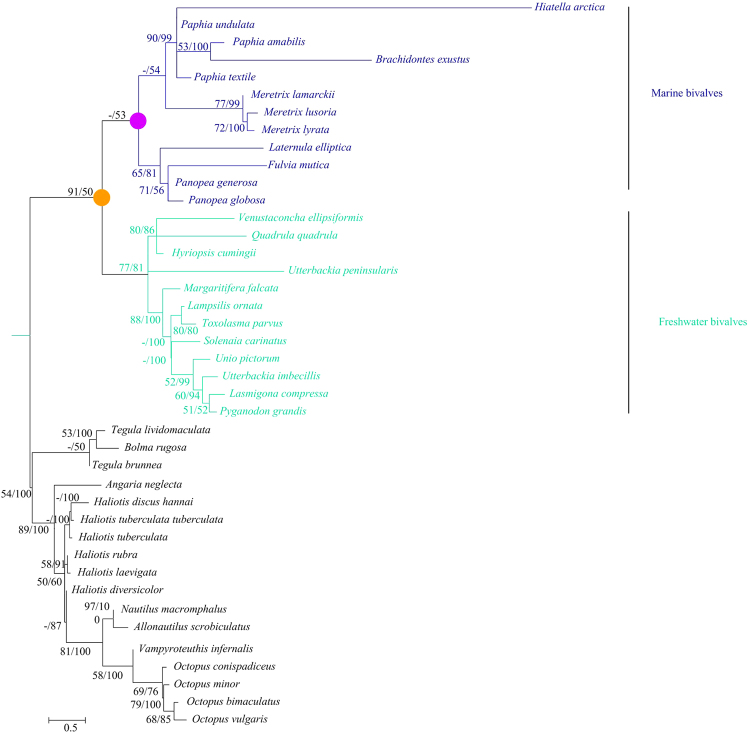
Figure 4.
The phylogenetic tree of Atp8 gene in molluscs under GTR + I + G substitution model of sequence evolution. Branch lengths are drawn to scale. ML bootstrap values/Bayesian posterior probabilities (>50%) are shown as numbers above the branches. The scale bar means 0.5 substitutions per site. The branch and species names colours identify the marine bivalves clade (blue) and the freshwater bivalves (turquoise). The common ancestor of bivalves and marine bivalves are marked in orange and purple circle, respectively.

