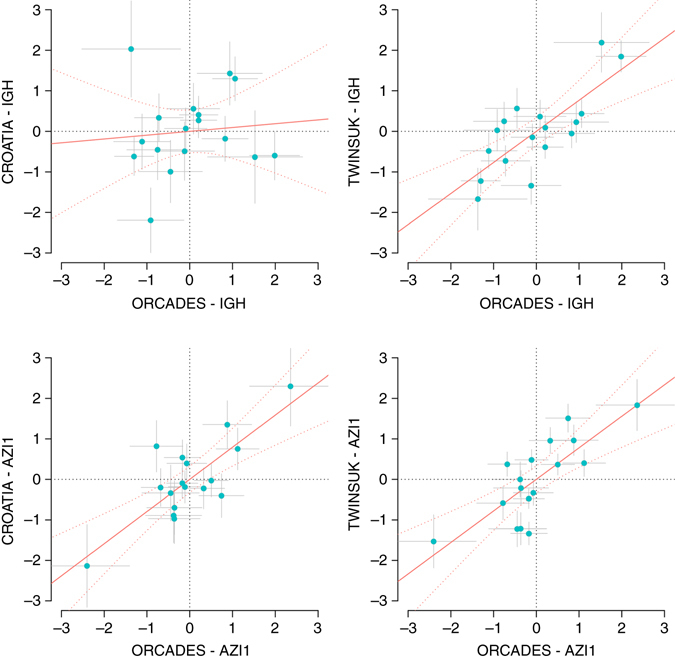
Fig. 2.

Comparison of the estimated genotype–phenotype partial correlations between discovery and replication cohorts. The IGH and AZI1 loci for the 17 traits in the IgG galactosylation group are displayed. The partial correlations were standardized to z-scores so that the regression slope and confidence intervals (red curves) represent the amount of correlation in the effect sizes between each named cohort. The gray bars represent standard errors
