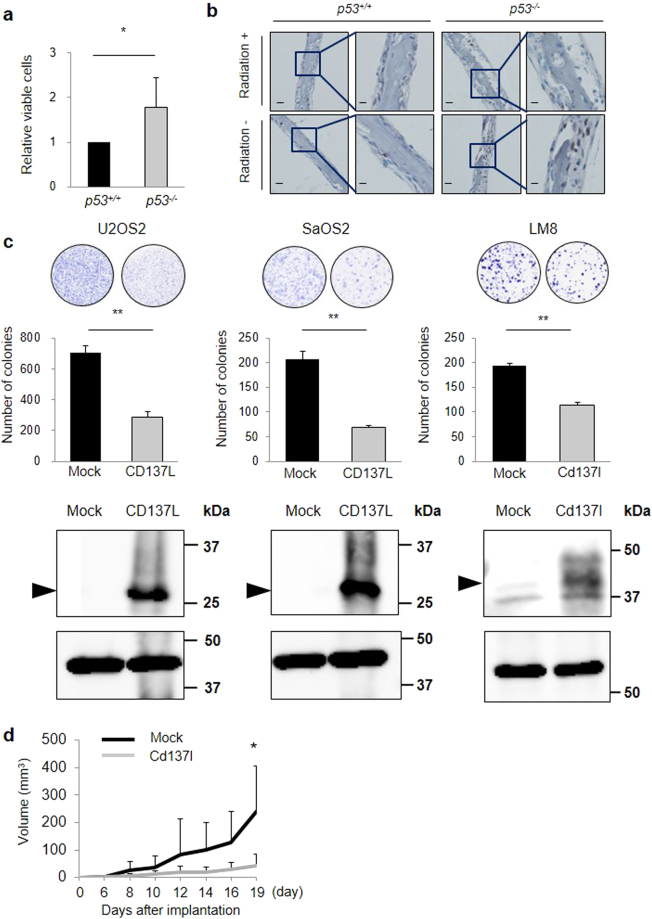
Figure 4.
Growth suppressive effects of p53 or CD137L. (a) p53 +/+ calvarial osteoblasts or p53 −/− calvarial osteoblasts were cultured on plates. Cell proliferation was assessed at 48 h. Error bars represent SD (n = 3). *P < 0.05, Student’s t-test. (b) Immunohistochemical staining of Ki67 in mouse p53+/+ or p53−/− calvaria with or without radiation exposure. Representative images from three tissues in each group are shown. Scale Bars (left) = 50 μm, Scale Bars (right) = 20 μm. (c) A colony formation assay was performed. After ectopic expression of CD137L or mock, the number of SaOS2, U2OS or LM8 cells was determined. Whole cell extracts were subjected to western blotting with a human or mouse anti-CD137L antibody. Error bars represent SD (n = 3). **P < 0.001, Student’s t-test. β-actin (U2OS and SaOS2) and α-tubulin antibody (LM8) was used as loading control. (d) Cd137l (n = 3) or mock (n = 3) stable expression cell lines were inoculated into the left and right flanks of C3H mice; each group contains 2 mice. The tumour volume was calculated every 2 or 3 days. *P < 0.05, Wilcoxon rank-sum test.

