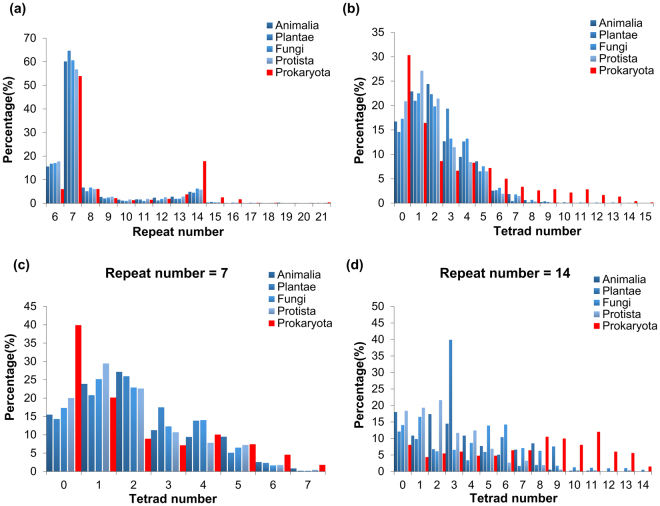
Figure 6.
Comparison of the repeat number and the tetrad number distributions between different taxonomic categories. In each panel, the red bars represent the data from Prokaryota, while the blue bars in different colour depth represent data from different eukaryotic categories. (a) The distributions of the repeat numbers of WD40 proteins in each taxonomic category. (b) The distributions of the tetrad hydrogen bond network numbers of WD40 proteins in each taxonomic category. (c) and (d) represent the tetrad number distributions of WD40 proteins with 7 repeats and 14 repeats, respectively.

