
Fig. 3.
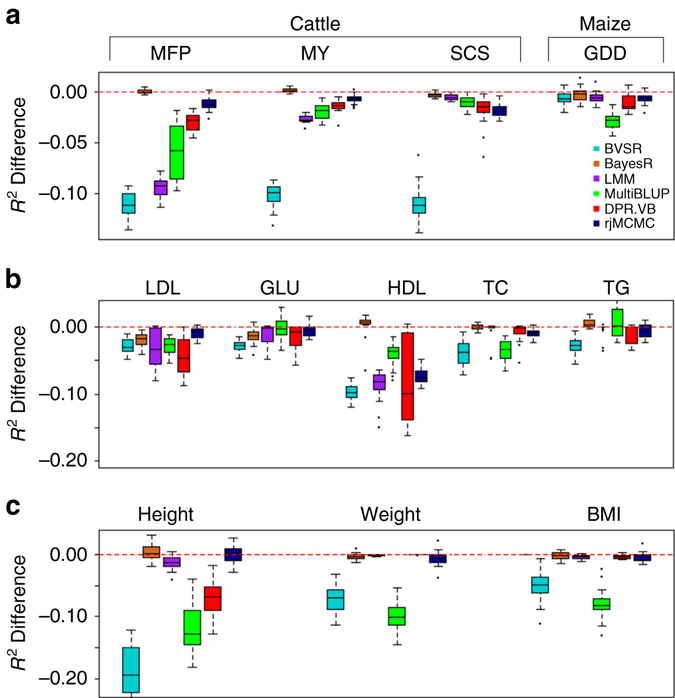
Comparison of prediction performance of several methods with DPR.MCMC for twelve traits from three data sets. a Prediction performance for MFP, MY and SCS in the cattle data, and for GDD in the maize data; b Prediction performance for the five plasma traits in the FHS data; c Prediction performance for the three anthropometric traits in the FHS data. Performance is measured by R 2 difference with respect to DPR.MCMC, where a negative value (i.e., values below the red horizontal line) indicates worse performance than DPR.MCMC. Methods for comparison include BVSR (cyan), BayesR (chocolate), LMM (purple), MultiBLUP (green), DPR.VB (red), rjMCMC (black blue), and DPR.MCMC. For each box plot, the bottom and top of the box are the first and third quartiles, while the ends of whiskers represent either the lowest datum within 1.5 interquartile range of the lower quartile or the highest datum within 1.5 interquartile range of the upper quartile. The sample R 2 differences are obtained from 20 replicates of Monte Carlo cross validation for each trait. For DPR.MCMC, the mean predictive R 2 in the test set and the standard deviation across replicates are 0.751 (0.011) for MFP, 0.624 (0.012) for MY, 0.551 (0.017) for SCS and 0.828 (0.012) for GDD, 0.081 (0.033) for LDL, 0.047 (0.017) for GLU, 0.153 (0.044) for HDL, 0.050 (0.020) for TC, 0.044 (0.015) for TG, 0.478 (0.031) for height, 0.169 (0.038) for weight, and 0.137 (0.037) for BMI. The SNP heritability estimates are 0.912 (0.007) for MFP, 0.810 (0.012) for MY, 0.801 (0.012) for SCS, 0.880 (0.013) for GDD, 0.397 (0.024) for LDL, 0.357 (0.036) for GLU, 0.418 (0.024) for HDL, 0.402 (0.036) for TC, 0.334 (0.034) for TG, 0.905 (0.013) for height, 0.548 (0.022) for weight and 0.483 (0.023) for BMI