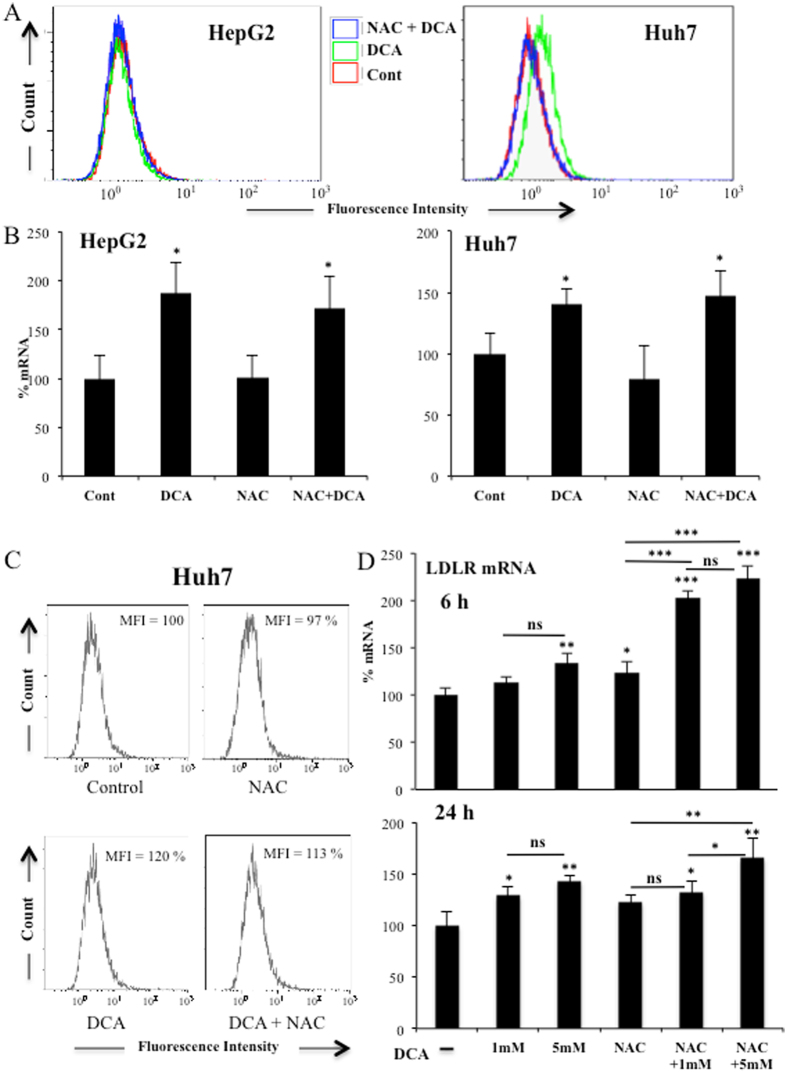
Figure 3.
Increase in ROS levels was not required for LDLR expression. (A) Both hepatic cell lines were treated with 2 mM NAC 1 h before adding DCA (10 mM) for 24 h. Cells were labeled with CH-H2DCFDA and analyzed by FACs for ROS production. LDLR mRNA (B) or protein (C) from these cells were analyzed as described in Fig. 1. Results represent the means ± SD of these donors with experiments performed in triplicate. The data represent means ± SD; *p < 0.05, **p < 0.01, ***p < 0.005 student t-test compared to cells non treated with DCA. D) Primary hepatocytes from 2 independent donors were treated for 6 and 24 h as in (A) but with two different DCA concentrations before analyzing LDLR mRNA expression. The data represent means ± SD; *p < 0.05, **p < 0.01, ***p < 0.005 one-way ANOVA with post-hoc Tukey test.

