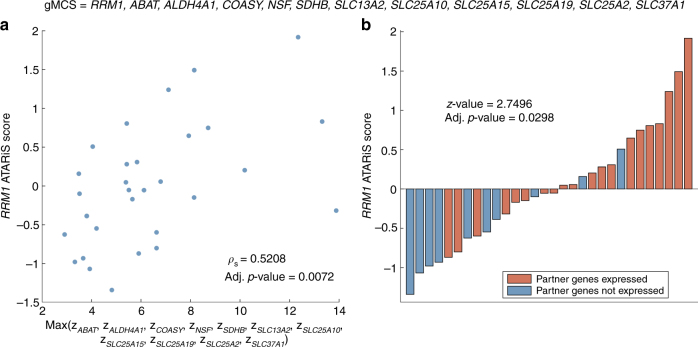
Fig. 4.
Sensitivity to RRM1 silencing in the top 30 Achilles cell lines regarding quality and expression of partner genes in gMCS6. a Spearman’s correlation analyzing the dependence of RRM1 ATARiS score on gene expression levels of partner genes in gMCS6. b Bar plot of RRM1 ATARiS score when partner genes are (or not) expressed in gMCS6. To decide whether a gene is expressed, we used the standard threshold provided by the Gene Expression Barcode algorithm 3.023

