Figure 2.
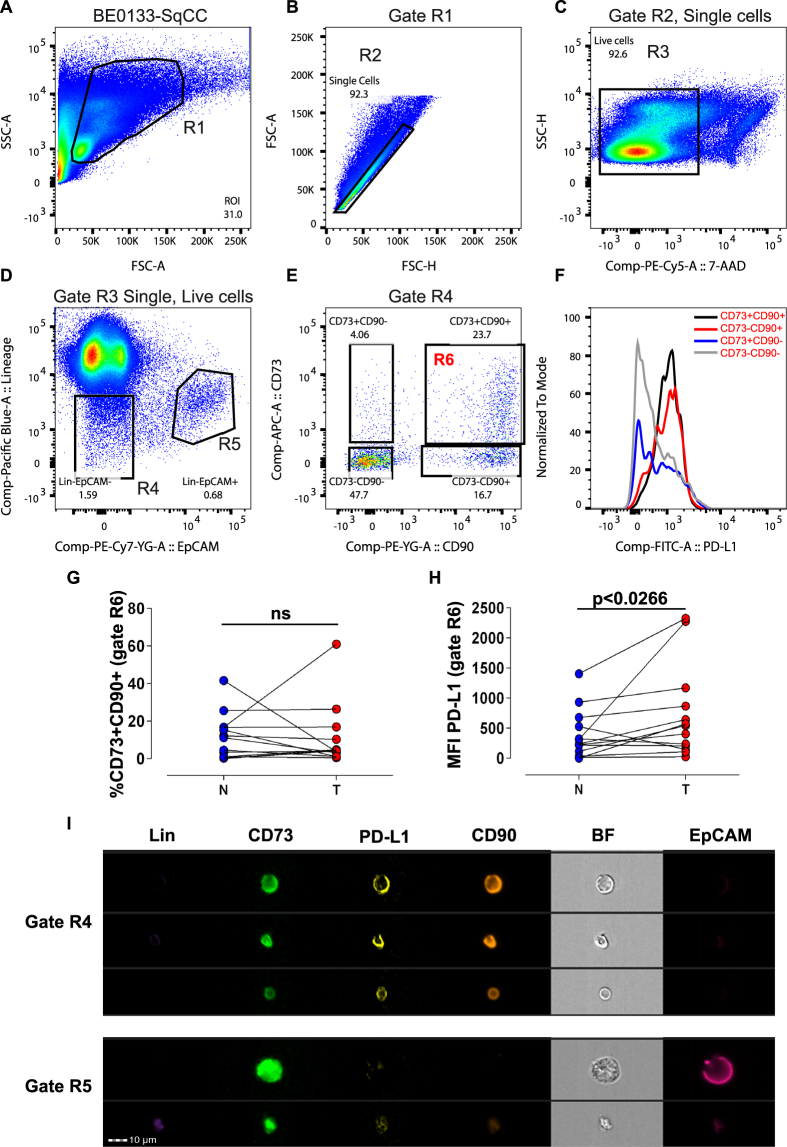
Prospective isolation of mesenchymal cell subset in NSCLC with increased expression of PD-L1. (A–E) Representative pseudocolor dot plots from a patient specimen (BE0133, squamous cell carcinoma) showing the gating strategy to identify clusters of mesenchymal cells within the NSCLC tumor specimen. Cells (R1 gate) initially displayed on a SSC/FSC color density plot (A) subgated to select single cells based on FSC-Area versus FSC-Height (R2 gate) (B), were further subgated for identification of live (7-AAD negative) cells (R3 gate) (C). Single, live cells (Gate R3) were displayed on a bivariate plot showing the presence of a cluster of Lin- cells that lacked the epithelial cell adhesion marker EpCAM (CD326) (R4 gate) and a cluster positive for EpCAM (R5 gate) (D). Lin-EpCAM- cells (Gate R4) displayed as a bivariate plot to identify CD73 and CD90 subset of cells (E). The expression of each subset for PD-L1 is shown on a histogram plot (F) (black: CD73+CD90+, red: CD73-CD90+, blue: CD73+CD90−, gray: CD73-CD90−). (G) Scatter plot showing the Lin-EpCAM-CD73+CD90+ cells (gate R6), as a percentage (%) of total counted events determined from Gate R4 (n = 13, biological replicates). (H) Scatter plot showing the mean fluorescence intensity (MFI) for PD-L1 in the Lin-EpCAM-CD73+CD90+ mesenchymal cell subset (gate R6) in tumor (T) versus matched nonadjacent uninvolved tissue (N) (n = 13, biological replicates). (I) Representative images obtained from a single lung adenocarcinoma cell using ImageStream®. Statistical analysis in G and H by Student t-test, two-tailed, for comparison of paired parametric data. All tests were two-tailed. *p < 0.05 were considered significant. See related supplementary data Figures S2–4.

