Figure 5.
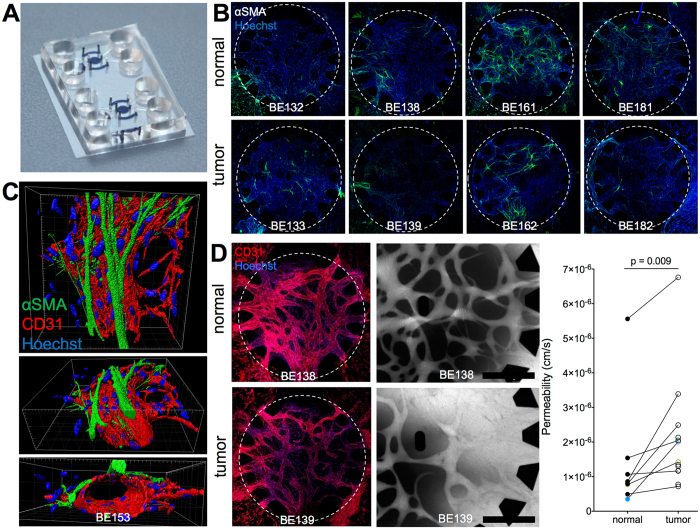
Microvessel formation, permeability and αSMA expression in surrounding pericytes. (A) A microfluidic chip with two round chambers for microvessel formation flanked by side channels for pericyte seeding (all chambers with cells and gel are marked in blue). (B) Representative images of a matched sample show αSMA + pericytes (green) in the microvascular chamber after one week in culture, counterstained with Hoechst (blue). Microvascular chambers are marked with a dotted line, diameter 2.4 mm. (C) 3D rendering of a αSMA + pericyte located on the abluminal surface of a CD31-stained microvessel. Scale bar: 30 μm. (D) Left: Endothelial microvascular networks continuously expressing CD31 (red) throughout the central chamber with open entrances between pillars. These networks form both when supported with normal (top) or tumor-derived (bottom) Lin-EpCAM-CD73+CD90+ cells. Center: Fluorescent 70 kDa RITC dextran (greyscale) show perfusability of microvascular networks and higher leakage of tumor PC-supported vessels compared to normal PC-vessels after 10 minutes. Scale bars: 500 μm. Right: Vascular permeability was measured with normal (n = 8) and tumor (n = 13) Lin-EpCAM-CD73+CD90+ cells (1 to 4 technical replicates per sample). Measurements from BE132-133 are marked in yellow and BE143-144 in blue. Statistical analysis in D by Student t-test, two-tailed, for comparison of paired parametric data. All tests were two-tailed. *p < 0.05 were considered significant. See related supplementary data Figure S9.

