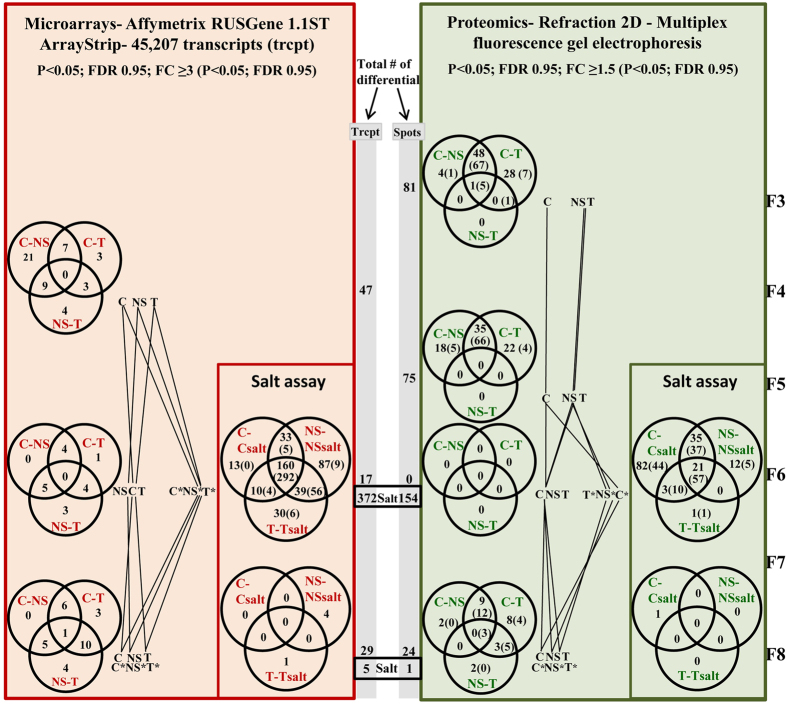
Figure 2.
Summary of differentially expressed transcripts/differentially abundant spots throughout generations. Venn Diagrams present the number of differentially abundant spots with a FC ≥ 1.5 and the differentially expressed transcripts with a FC ≥ 3 in each situation. Whenever applied, we present between brackets the redistribution of these spots/transcripts neglecting fold change. For simplification on left panels NSb is represented as NS and Ta as T. Trcpt- Transcripts.

