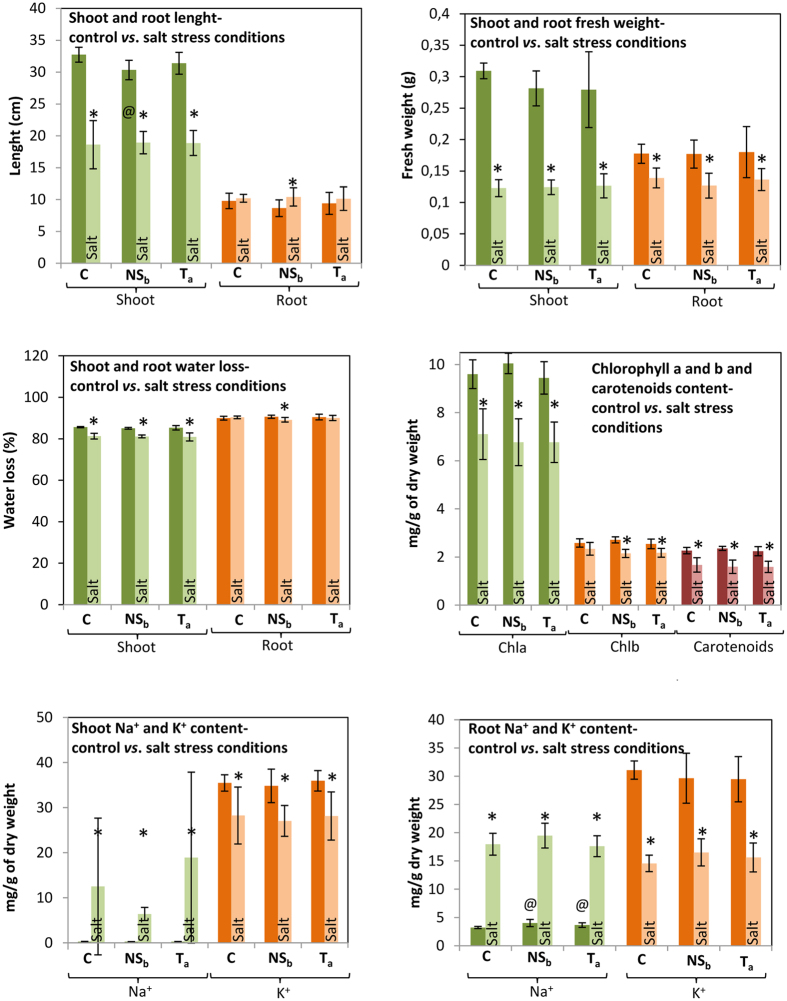
Figure 4.
Physiological parameters of F6 plants. For each physiological parameter and plant tissue, statistical significant differences between control and stressed plants, for each line, and among the three rice lines grown in the same environmental conditions, were evaluated. Except for the rice lines highlighted with @ (symbol means statistically different from Control line, p < 0.05) lines grown in the same environmental conditions (C vs. T; C vs. NS; NS vs. T; Csalt vs. Tsalt; Csalt vs. NSsalt; NSsalt vs. Tsalt) present no statistically different physiological parameters. Asterisks (*) represent statistically significant differences (p < 0.05) between control vs. stressed plants (C vs. Csalt; NS vs. NSsalt and T vs. Tsalt). Error bars represent standard deviation.

