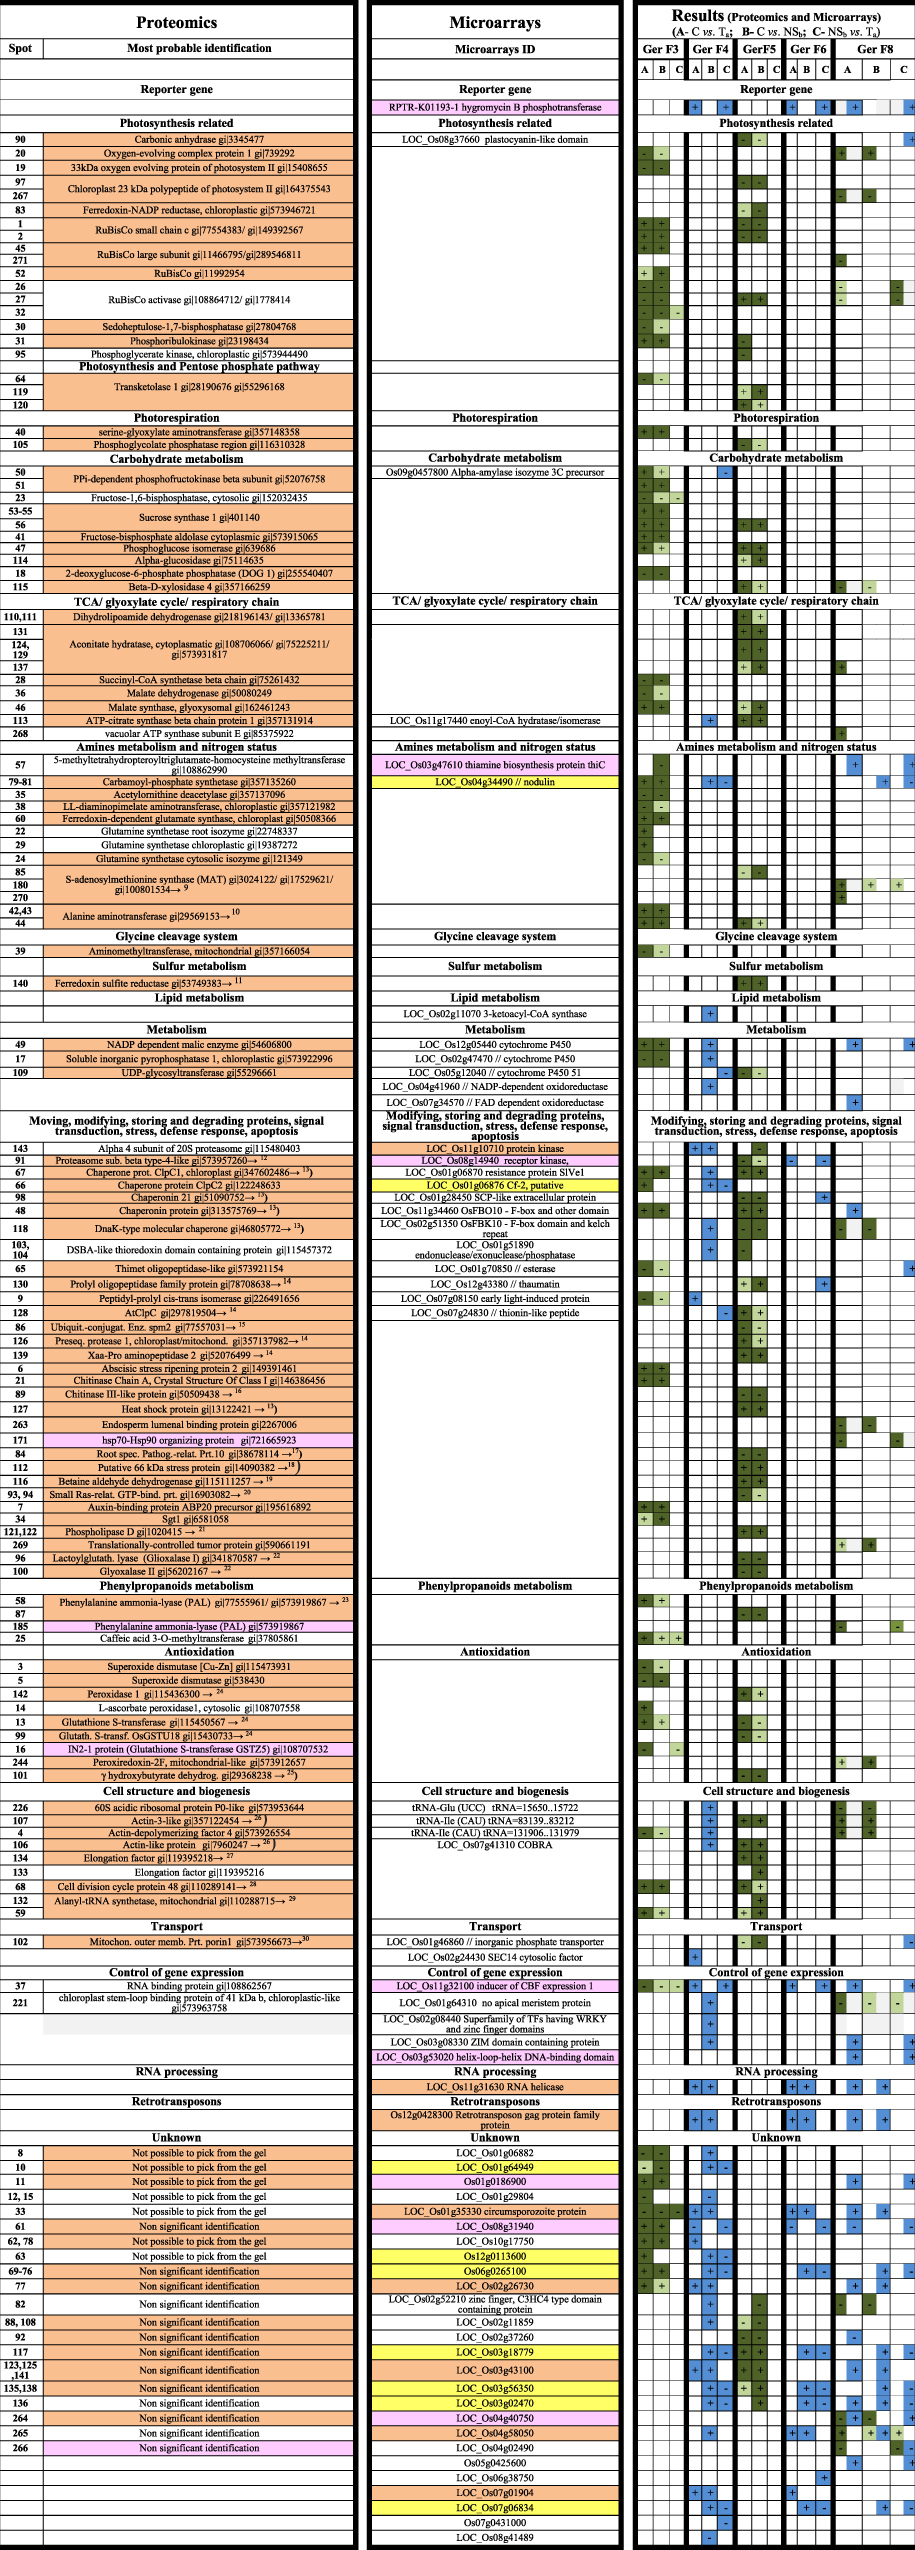
Table 1.
Proteomic and Microarrays results throughout generations (salinity assay not included). Identifications organized by biological process. Proteomics results are presented in green: differentially abundant spots with a FC ≥ 1.5 at least in one of the comparisons (C vs.Ta; C vs. NSb; NSb vs. Ta); dark green-Fold Change ≥ 1.5; light green- Fold Change < 1.5. Microarrays results are presented in blue: differentially expressed transcripts with a FC ≥ 3 at least in one of the comparisons (C vs.Ta; C vs. NSb; NSb vs. Ta); all in blue- Fold Change ≥3). Orange shadowed- in vitro culture related; Pink shadowed- transgenesis related; Yellow shadowed- negative segregant (NSb) specific. Numbers in front of proteins’ identifications regards to references supporting its relation with plant stress. + means up-regulated; − means down-regulated. Note: Protein identifications are independent from transcripts identifications even when on the same table line.

