
Figure 5.
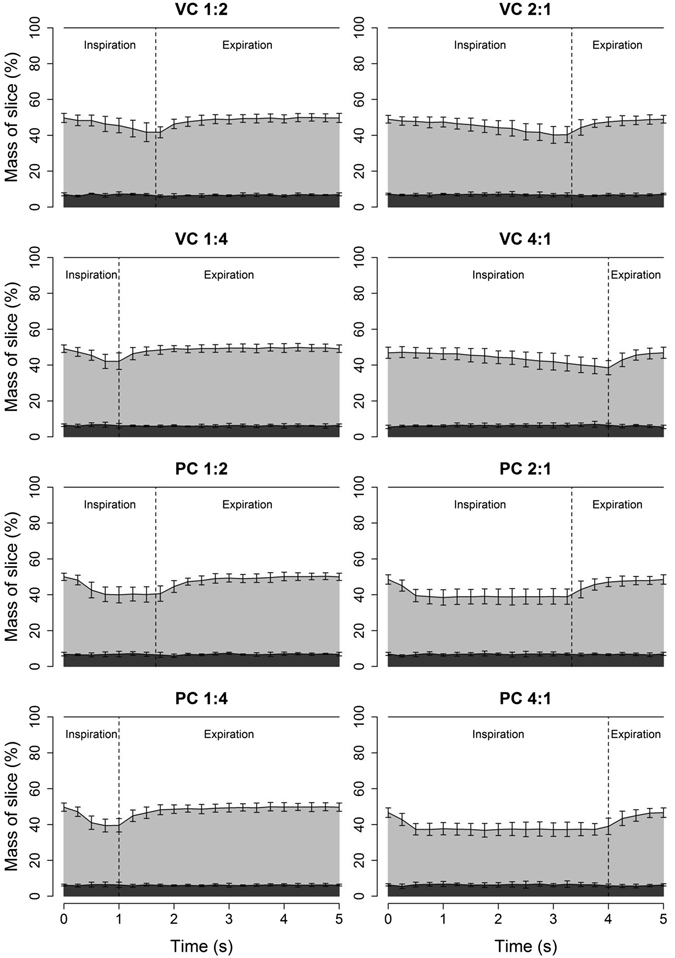
Variation in mass of different density fractions of a single CT slice during tidal ventilation in uninjured animals in different ventilation modes. During inspiration, atelectatic lung (dark grey) decreased marginally with a greater decrease in poorly aerated mass (light grey) and a reciprocal increase in normally aerated lung (white). Overdistended lung represented less than 0.1% of the mass of the slice and was excluded from the figure. Error bars represent SD at each time point. Panel subtitles indicate ventilation mode and I:E ratio. VC – volume control; PC – pressure control.