
Fig. 3.
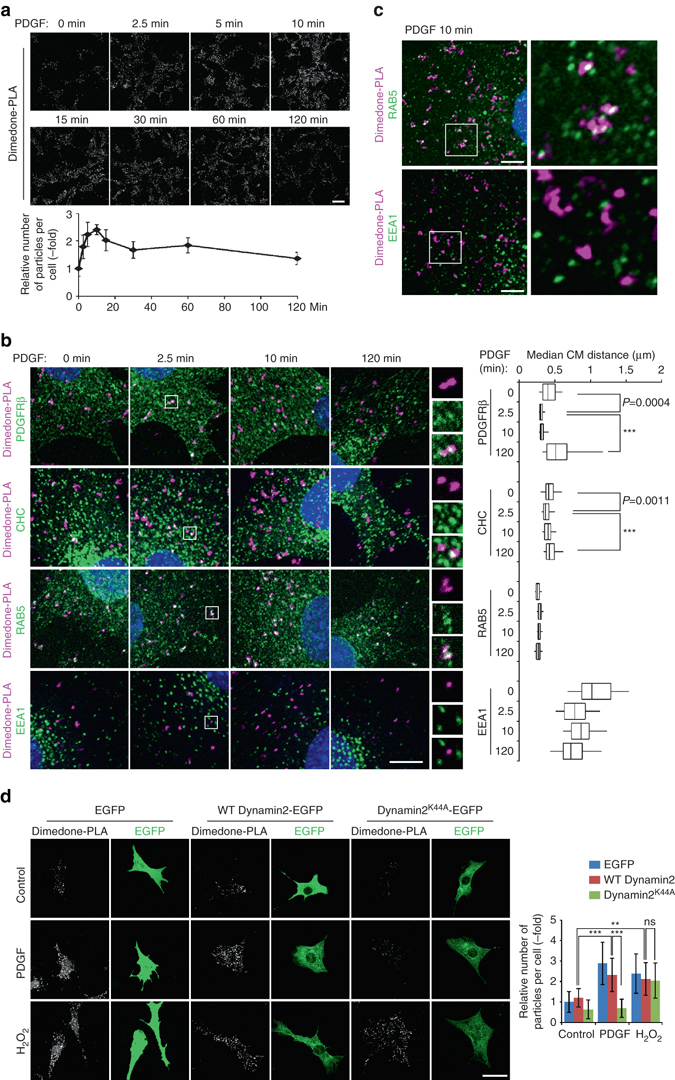
Spatio-temporal dynamics of SHP2 oxidation. a Serum-starved Swiss 3T3 cells were stimulated with PDGF-BB (50 ng ml−1) for the indicated times, and subjected to dimedone-PLA. Representative images are shown for each condition from one of two independent experiments. The graph shows the average number of PLA signals per cell (n = 6 images for each condition, 5–20 cells in an image), relative to unstimulated control cells (normalized to 1). Scale bar: 50 μm. b Serum-starved Swiss 3T3 cells were stimulated with PDGF-BB (50 ng ml−1) for the indicated times. Dimedone-PLA (magenta) and co-staining with the indicated markers (green) are shown. Nuclei were stained with DAPI (blue). Representative images are shown for each condition from one of three independent experiments. Higher magnification images of the boxed regions are shown. Median distances of centers of mass (CM) between punctate signals of ox-SHP2 and the nearest indicated marker signal in cells were obtained by object-based image analysis. The box-whisker plots show the median inter-object distances at the indicated times after stimulation (n = 50 cells, each time point). Boxes indicate the 25th–75th percentile; whiskers represent the 5th–95th percentile. ***P < 0.0001, ANOVA with Bonferroni/Dunn’s post-hoc test. Scale bar: 10 μm. c Serum-starved Swiss 3T3 cells were stimulated with PDGF-BB (50 ng ml−1) for 10 min, and subjected to dimedone-PLA (magenta) and co-staining with the indicated antibodies (green). Representative semi-super resolution microscopic images (AiryScan) and higher magnification images of the boxed region from one of two independent experiments are shown. Scale bars: 5 μm. d Swiss 3T3 cells expressing EGFP, EGFP-fused wild type dynamin2 (WT Dynamin2) or dominant-negative dynamin2 (dynamin2K44A) were serum-starved and stimulated with PDGF-BB (50 ng ml−1) or H2O2 (1 mM) for 10 min, and subjected to dimedone-PLA. Representative images of co-staining of dimedone-PLA (gray) and EGFP (green) are shown for each condition from one of two independent experiments. The graph represents the average number of PLA signals per cell (n = 15 cells), relative to unstimulated control cells (normalized to 1). ***P < 0.0001, ns not significant, ANOVA with Bonferroni/Dunn’s post-hoc test. Scale bar: 50 μm. Error bars represent SD