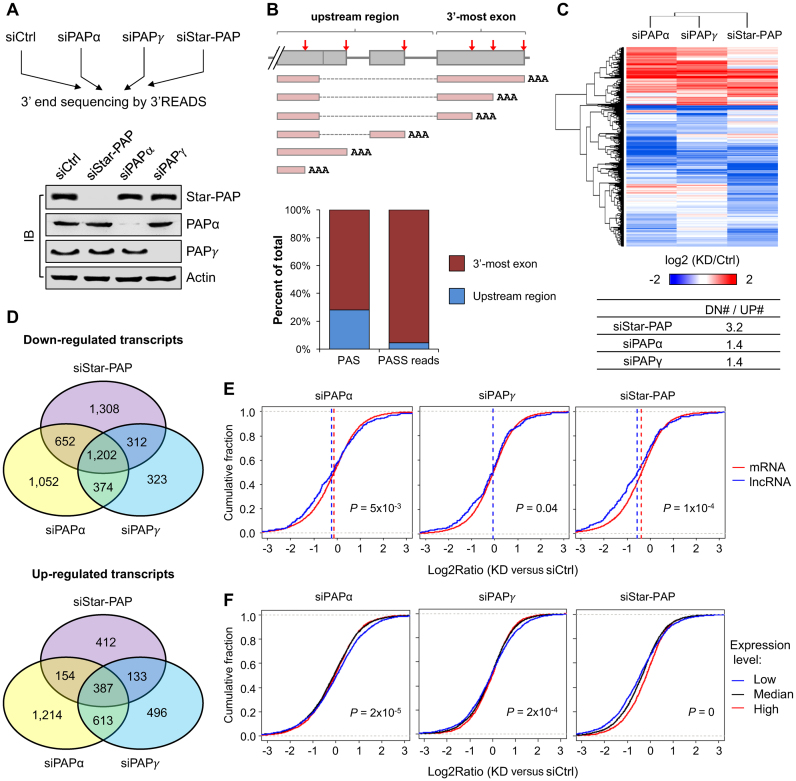
Figure 1.
Genome-wide regulation of gene expression by PAPs. (A) Top, experimental design. HEK 293 cells were used. Bottom, the knockdown efficiencies of the individual PAPs were examined by Immunoblot (IB). (B) Top, schematic of PASs in a gene. Bottom, distribution of identified PASs and PASS reads from 3′READS. PASS reads were those with at least two non-genomic ‘A’s at the end. (C) Change of transcript expression level after KD of Star-PAP, PAPα or PAPγ. Each transcript was based on one PAS. Those with fold change >2 and total read counts >50 were plotted using the color scale shown at bottom. Samples were clustered using hierarchical clustering with Pearson Correlation coefficient as metric. The ratio of number of downregulated transcript to that of upregulated ones in each KD was shown in a table below the heatmap. (D) Venn diagrams comparing transcripts similarly or differently downregulated (top) or upregulated (bottom) upon each PAP KD. (E) Expression profiles of mRNAs and lncRNAs in each KD sample. (F) Expression levels of the different genes affected by PAP KD. Low, median and high expression genes were those <25th, 25th–75th, >75th percentiles, respectively. P-value was based on K-S test comparing <25th with >75th groups.

