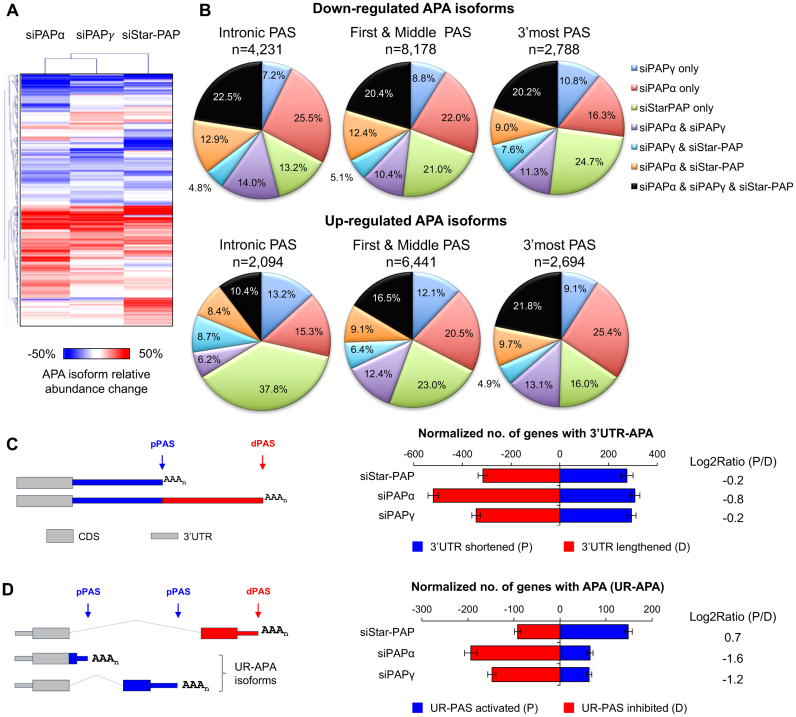
Figure 2.
Widespread APA events regulated by PAPs. (A) Heatmap showing APA changes in three KD samples. Only those with significant changes (FDR < 0.05, Significance Analysis of Alternative Polyadenylation; SAAP) were selected and shown in the heatmap using the color scale shown below the plot. Samples were clustered using the hierarchical clustering with Pearson correlation coefficient as metric. (B) Pie charts summarizing commonly or uniquely regulated APA events. (C) Left, schematic of 3′UTR-APA. Right, regulation of 3′UTR-APA as analyzed by Global Analysis of Alternative Polyadenylation (GAAP). The log2Ratio of the number of genes with 3′UTR shortened (P for proximal) to the number of genes with 3′UTR lengthened (D for distal) was shown. (D) Left, schematic of UR-APA. Right, regulation of UR-APA as analyzed by GAAP. Right, the log2Ratio of the number of genes with UR-PAS usage activated to the number of genes with UR-PAS usage inhibited was shown.

