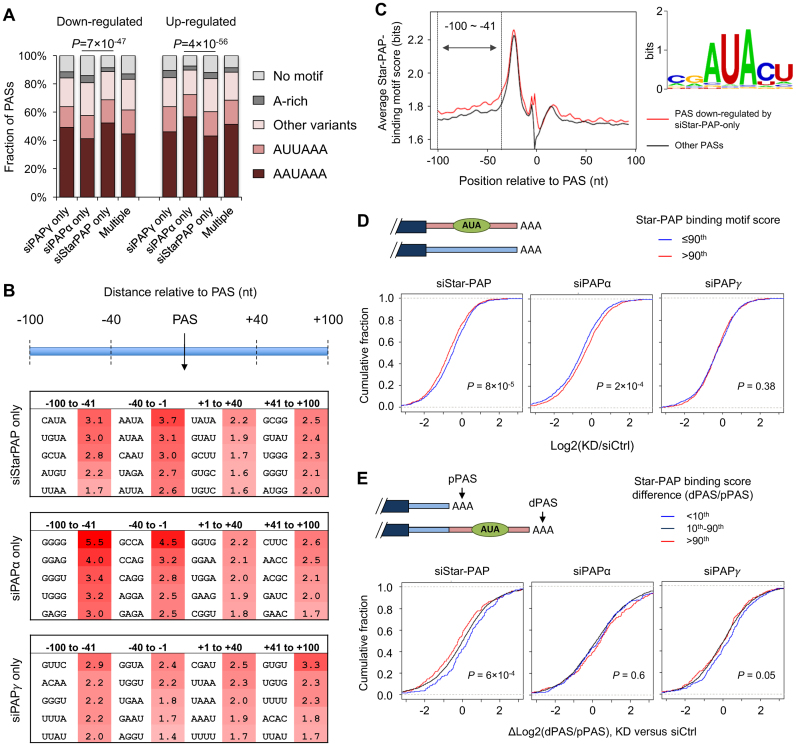
Figure 3.
Sequence motifs associated with Star-PAP-dependent PAS usage. (A) Polyadenylation signal AAUAAA and its variants in the PASs that were commonly or uniquely regulated by the three PAPs. Other variants are 10 single nucleotide variants reported in (38) and A-rich motif was defined in (62). ‘Multiple’ stands for the PAS group commonly regulated by all three PAPs. Chi-square test P-values between siStarPAP-only and siPAPα-only groups were indicated. (B) Tetramers enriched for sequences around the PASs regulated by different PAPs. Numbers in the table were –log10 (P-value) (Fisher's Exact Test, see ‘Materials and Methods’ section for details). Four regions around the PAS were analyzed as indicated at the top. (C) Star-PAP binding motifs around the PAS. Left, Average Star-PAP binding motif scores around the PASs whose corresponding transcripts were downregulated by siStar-PAP only (red line) and other PASs (black line) that were not affect by KD of Star-PAP. Right, the Star-PAP binding motif sequence logo. (D) Cumulative distribution function (CDF) curve of log2Ratio of transcripts with predicted Star-PAP binding in three KD samples. Those with highly predicted Star-PAP binding were scored above the 90th percentile (red line) in the −100 to −41 nt region upstream of the PAS, while the target binding motif scores ≤90th (blue line) represent lower binding affinity. P-values (based on K-S test) comparing two PAS groups were indicated in the plots. (E) CDF curve of PAS relative expression difference (RED, see ‘Materials and Methods’ section for detail) between distal and proximal 3′UTR-PASs for three groups of genes, which were selected based on the difference in predicted Star-PAP binding between distal and proximal PAS isoforms. The Star-PAP binding prediction was based on the averaged motif score in the −100 to −41 nt region upstream of the PAS. P-values (K-S test) were indicated for the difference between the blue and red lines, corresponding to the <10th percentile and >90th percentile sets, respectively.

