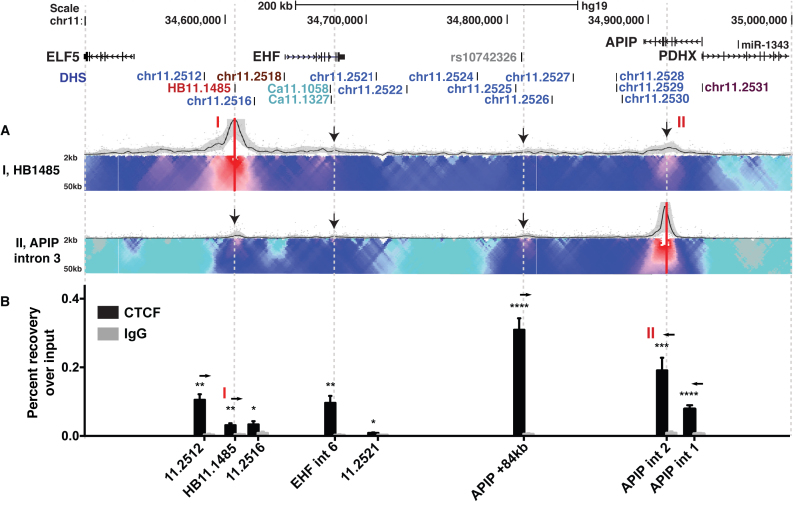
Figure 5.
The topologically associating domain encompassing the 11p13 CF modifier region. (A) 4C-seq data are presented as described in Figure 3. Viewpoints are from the HB11.1485 (I) and APIP intron 3 (II) elements. (B) ChIP-qPCR for CTCF enrichment across the 11p13 locus in Calu3 cells. Amplicons are at 11.2512 (EHF -55kb), HB11.1485 (I), DHS 11.2516, EHF intron 6, 11.2521, APIP +84kb, APIP intron 2 (II), and APIP intron 1. Data are shown as percent recovery over input for CTCF (black bars) and IgG control (gray bars). Arrows denote CTCF motif orientation. n = 3. ****P < 0.0001, ***P < 0.001, **P < 0.01, *P < 0.05.

