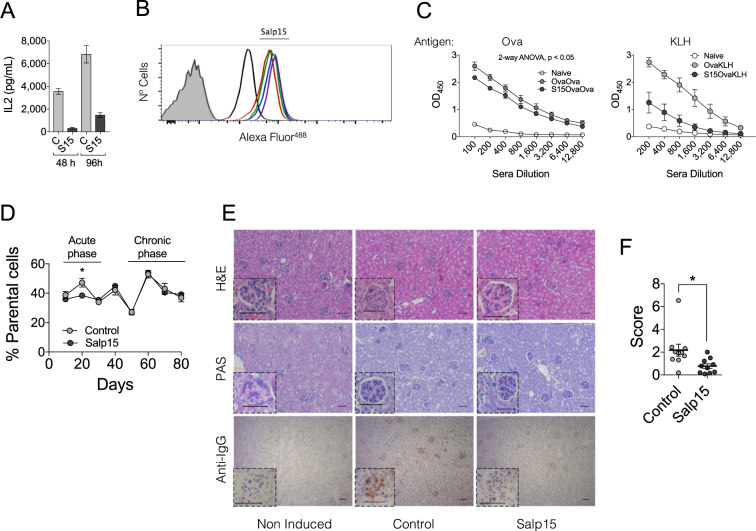
Figure 1.
The effect of Salp15 on CD4 T cells is long-lasting. (A) IL-2 production by purified splenic CD4 T cells activated with anti-CD3/CD28 for 2 days in the presence of 50 μg/ml of Salp15, washed and re-stimulated under the same conditions for another 48 h in the absence of the immunosuppressive protein. The results represent the average ± SE of one experiment in triplicate and are representative of 3 performed. (B) Binding of Salp15 or the C-terminal deletion mutant, Salp15ΔP11 to purified CD4 T cells. The proteins were labeled with Alexa Fluor488 and tested for their binding for different time periods. The binding was assessed by flow cytometry. The shaded histogram represents unlabeled cells. The black histogram represents binding of Salp15ΔP11. Color histograms represent binding of Salp15 at different time points (12, 24, 48 and 72 h). (C) Antibody titers specific for ovalbumin (left panel) and KLH (right panel) in mice immunized with the antigens as described in Methods and treated with 50 μg of Salp15 (S15OvaOva or S15OvaKLH) or left untreated (OvaOva or OvaKLH). Non-immunized mice served as controls (Naive) (D) Percentage of parental (H2b) cells in the blood of transplanted CB6F1 mice (H2b,d) over a period of 80 days. The mice were either treated with 50 μg of Salp15 or Salp15ΔP11 (Control) (E) Histological features of the kidneys of CB6F1 mice transplanted with B6 splenocytes after 80 days. Kidney sections were stained with H&E (top panels), periodic acid schiff (PAS) staining (middle panels) and anti-mouse IgG immune complex deposition (lower panels). The scale bars represent 50 μm. (F) Assessment of IgG immune complex deposition scores in the kidneys of the transplanted mice by analysis of 5 different micrographs with the FriDA software package and averaged per section. The experiments in vivo were performed with groups of 5 mice and performed at least twice.

