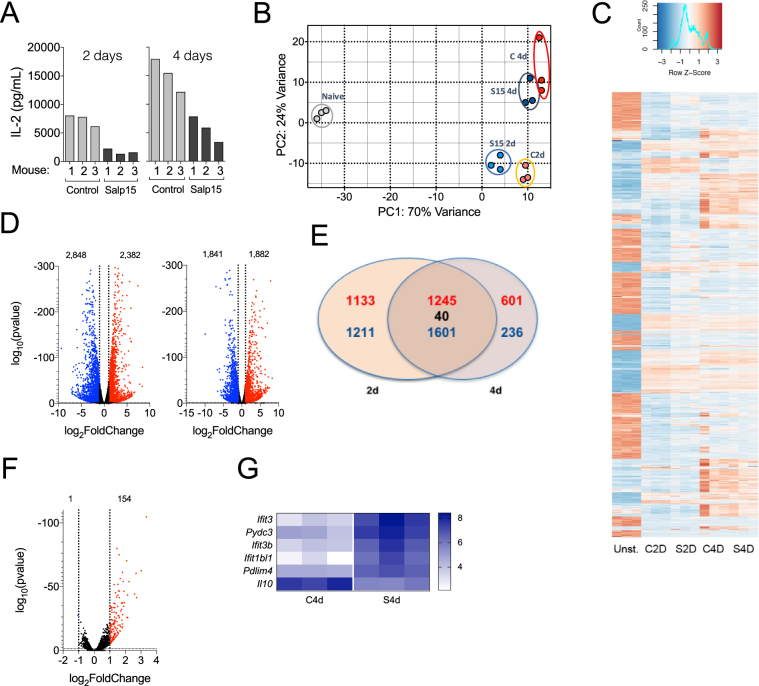
Figure 2.
Transcriptional traits of CD4 T cells activated in the presence of Salp15. (A) IL-2 production by CD4 T cells used for the transcriptomic analysis. Each bar represents one of the 3 mice used. The amount of Salp15 used was 25 μg/ml. Control cells were treated with Salp15ΔP11 (Control). (B) Principal component analysis showing the grouping of the different assay conditions according to their transcriptome. Non-activated cells (Naive, grey); Salp15ΔP11-treated at 2 days (C 2d, orange) or 4 days of activation (C 4d, red); Salp15-treated at 2 days (S15 2d, light blue) or 4 days (S15 4d, dark blue). (C) Heatmap corresponding to the 1000 most regulated genes over the conditions analyzed by RNAseq. (D) Volcano plots showing the genes upregulated (red) or downregulated (blue) by activation with anti-CD3 and CD-28 at 2 (left) and 4 days (right) of stimulation. (E) Venn diagram showing the number of genes regulated at both 2 and 4 days of activation in the absence of Salp15. (F) Volcano plot showing the number of genes differentially regulated during the activation of CD4 T cells in the presence of Salp15 or Salp15ΔP11 (control) after 2 days of stimulation. (G) Heatmap of the genes regulated in the presence of Salp15 at 4 days of activation.

