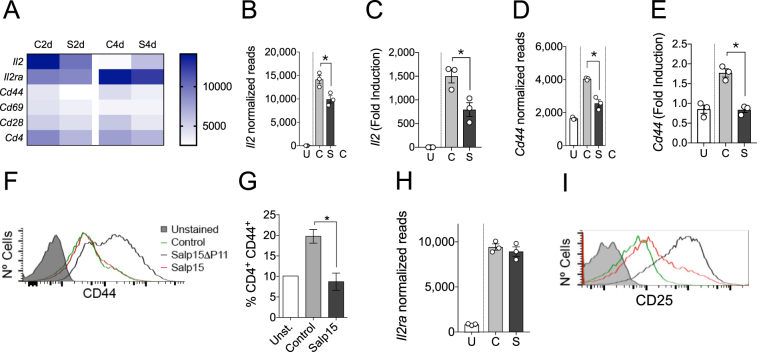
Figure 3.
Salp15 affects the activation of CD4 T cells. (A) Heatmap of genes involved in the activation of CD4 T cells at 2 and 4 days of stimulation with anti-CD3/CD28 in the absence or presence of Salp15. (B) Normalized reads corresponding to the Il2 gene at 2 days of activation in the presence of Salp15 (S) or Salp15ΔP11 (C). U- Unstimulated cells. (C) Transcriptional levels of Il2 at 2 days of activation in the presence of Salp15 (S) or Salp15ΔP11 (C) of Salp15 determined by qRT-PCR. Normalized reads of Cd44 (D) and transcriptional levels by qRT-PCR (E) in CD4 T cells at 2 days of activation, as before. (F) Surface CD44 levels on CD4 T cells activated for 2 days in the presence of Salp15 or Salp15ΔP11. Control: Unstimulated cells. The grey histogram represents an unstained control. (G) Percentage of CD4 T cells expressing CD44 in the spleen of mice immunized with ovalbumin and treated with Salp15 compared to control treated, immunized mice (Control) and non immunized mice (Unst.). (H) Normalized reads of Il2ra in CD4 T cells at 2 days of activation, as before. (F) Surface CD25 levels on CD4 T cells activated for 2 days in the presence of Salp15 or Salp15ΔP11. The color legend is as indicated in (F). All the experiments were performed with 25 μg/ml of Salp15 or Salp15ΔP11 (control).

