Figure 4.
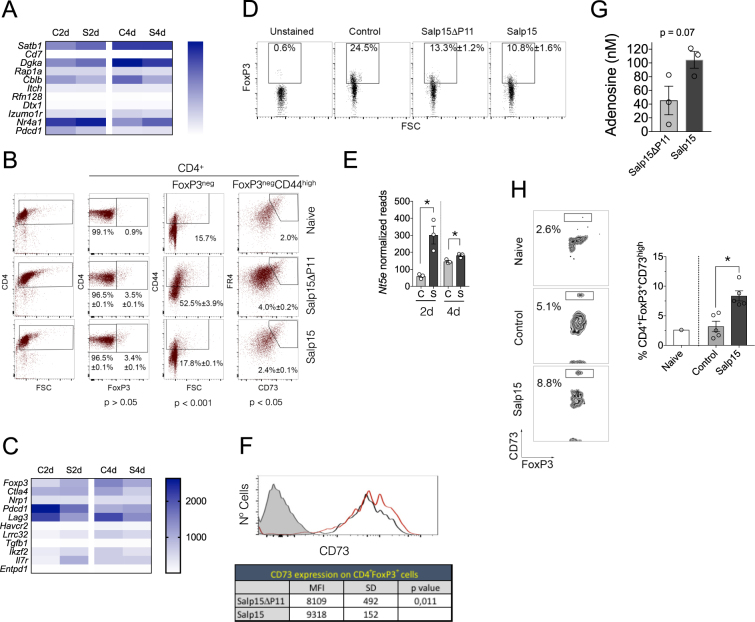
Salp15 does not induce increased anergic or Treg numbers but augments the levels of CD73 in FoxP3+ cells. (A) Heatmap representing genes associated with anergy in CD4 T cells according to the RNAseq analysis in the presence of Salp15 (S) or Salp15ΔP11 (C) at 2 and 4 days of activation. (B) Percentage of FoxP3+ and anergic CD4 T cells upon their exposure to 25 μg/ml of Salp15 or Salp15ΔP11 for 2 days. The average ± SE of triplicates is indicated. The p values (Student´s t test) correspond to the comparison between the Salp15ΔP11 and Salp15 groups. The data presented is representative of 2 independent experiments with similar results. (C) Heatmap corresponding to genes associated with regulatory T cells according to the RNAseq analysis in the presence of Salp15 (S) or Salp15ΔP11 (C) at 2 and 4 days of activation. (D) Percentage of FoxP3-positive CD4 T cells upon exposure to 25 μg/ml of Salp15 or Salp15ΔP11 in vitro for 2 days during activation. The values correspond to the average ± SE of 5 mice per group. No significant differences were detected between the Salp15ΔP11 and Salp15 groups. The data is representative of 2 independent experiments. (E) Normalized reads corresponding to the expression levels of Nt5e at 2 and 4 days of activation in vitro in the presence of Salp15 (S) or Salp15ΔP11 (C). (F) Surface expression levels of CD73 on CD4+FoxP3+ T cells (top) activated for 2 days in the presence of 25 μg/ml of Salp15 (red histogram) or Salp15ΔP11 (black histogram). The shaded histogram represents an unstained control. The table shows the average mean fluorescence intensity (MFI) ± standard deviation (SD) of 5 mice per group. Differences of the means were analyzed by the Student´s T-test. (G) Average adenosine levels in the supernatants of CD4 T cells activated in the presence of 25 μg/ml of Salp15 or Salp15ΔP11 for 2 days. The results represent 3 independent mice. (H) Increased percentage of CD4+FoxP3+CD73high cells in the blood of CB6F1 mice transplanted with B6 splenocytes at day 50 post induction. The histogram on the right represents the average ± SE of 5 control (Salp15ΔP11) and 5 Salp15-treated mice. *p < 0.05.

