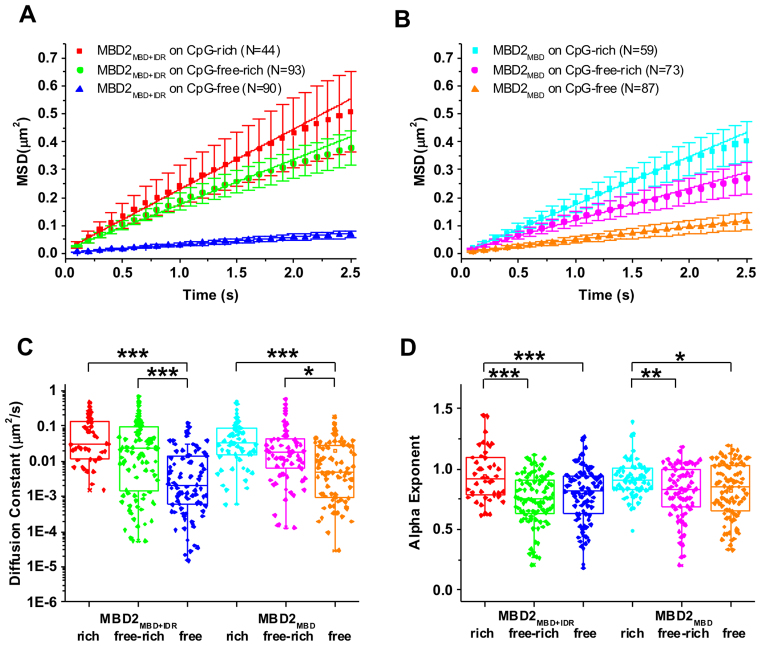
Figure 3.
Diffusion constant, alpha exponent of MBD2MBD+IDR and MBD2MBD on three types of DNA substrates. Plots of average values of MSD versus time for MBD2MBD+IDR (A) and MBD2MBD (B) on CpG-rich, CpG-free-rich and CpG-free DNA tightropes. The error bars represent SEM. (C and D) Diffusion constants (C) and alpha exponents (D) of MBD2MBD+IDR and MBD2MBD on CpG-rich, CpG-free-rich, and CpG-free DNA tightropes (Table 2). ***P < 0.0005; **P < 0.005; *P < 0.5.

