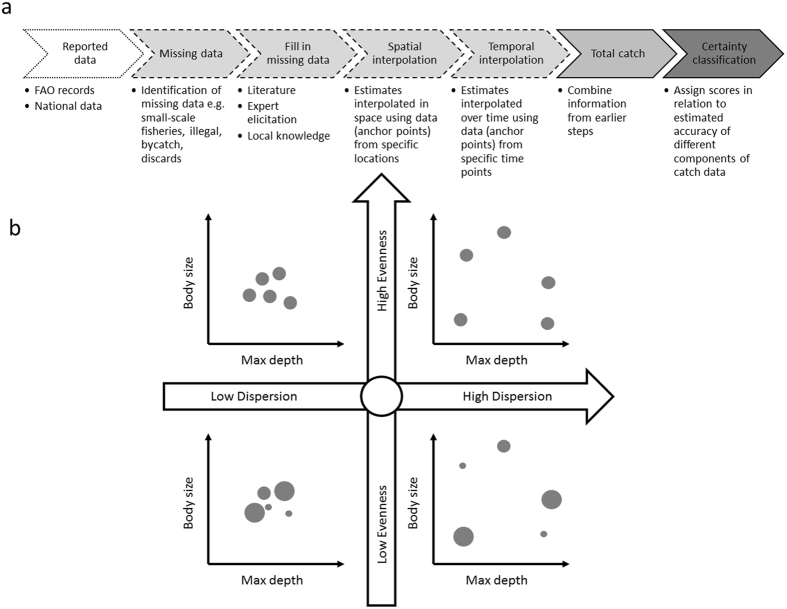
Figure 1.
Catch reconstruction process and functional diversity metrics. (a) Sources and flow of information used in catch reconstruction process from the reported data, addition of unreported data (including small-scale and illegal fisheries, bycatch and discards), and classification of estimated certainty of catch data. Certainty scores are based on qualitative expert assessment of the relative accuracy of the catch estimate derived from the underlying data, assumptions and methods used for each sector and country, and were developed from a similar approach used in the IPCC process. (b) Four examples of catch data displayed in trait space, with tonnage caught of each taxon indicated by bubble size. Panels illustrate differences between communities with the same number of taxa and total biomass but varying levels of dispersion and evenness. For illustrative purposes, the two traits body size and maximum depth are shown. Figure (A) created from information in ref. 13

