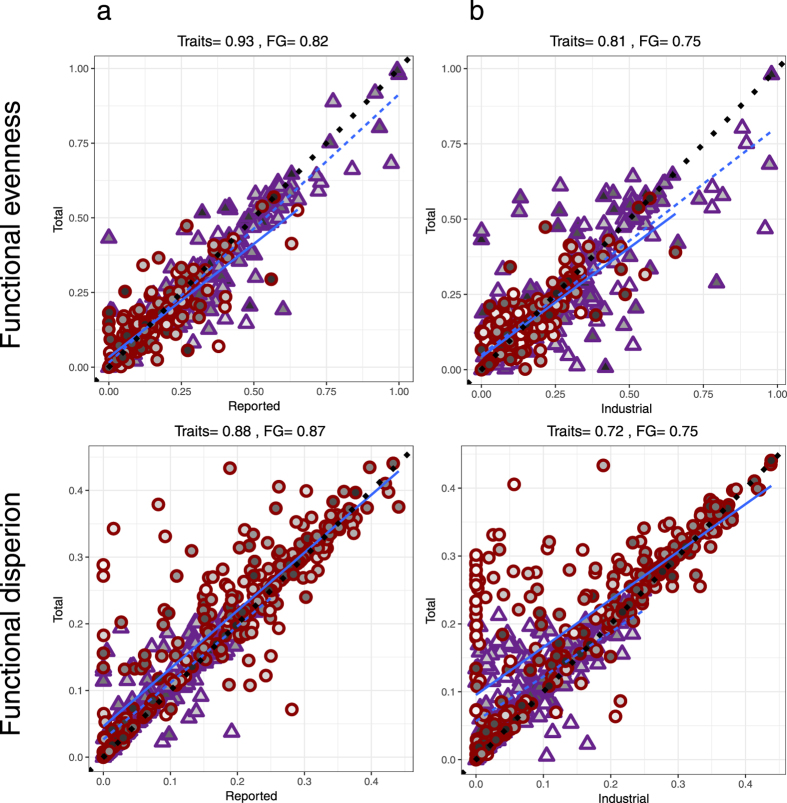
Figure 5.
Correlations among estimates of functional metrics for total catch versus different catch groupings. (a) Reported data and (b) industrial catch. Dotted black line is y = x relationship and statistics presented are spearman rank rho values. Each data point is an EEZ in 2010. Purple triangles and dashed lines are estimates using trait information, red circles and solid lines are estimates using broad functional groups (FG). Shading represents proportion of the catch that is either reported or industrial (low values-light shading, high values-dark shading).

