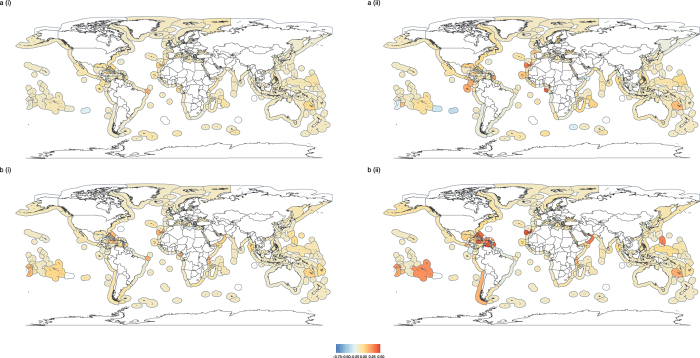
Figure 7.
Difference between functional dispersion estimates of total catch data and (a) reported data and (b) industrial data, where metrics are estimated using either (i) detailed trait information or (ii) broad functional groups for EEZs in 2010. White shading in EEZs represents missing data, where there were either too few functionally distinct taxa to estimate dispersion or insufficient data at the species/genus level (trait analysis only). Maps created in using the ggplot245 package in R46.

