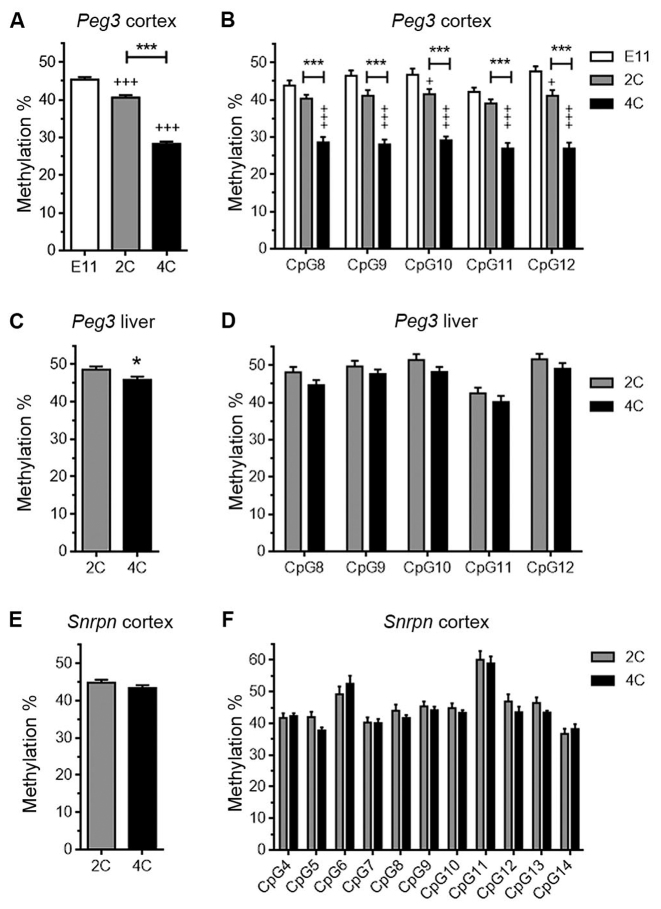
Figure 3.
Reduced methylation levels in the PCD of cortical neurons. (A) Global pyrosequencing analysis of the CpG sites present in the PCD of E11 telencephalic neuroepithelial cells, and 2C and 4C cortical neurons. +++P < 0.005 (versus E11); ***P < 0.005 (versus 2C). (B) Pyrosequencing analysis of individual CpG sites (numbered as in Figure 2A) in the PCD of E11 telencephalic neuroepithelial cells, and 2C and 4C cortical neurons. +++P < 0.005; +P < 0.05 (versus E11); ***P < 0.005 (versus 2C). (C and E) Global pyrosequencing analysis of the CpG sites present in the PCD of 2C and 4C hepatocytes (C) and in the SCD of 2C and 4C cortical neurons (E). *P < 0.05 (versus 2C). (D and F) Pyrosequencing analysis of individual CpG sites (numbered as in Figure 2A) in the PCD of 2C and 4C hepatocytes (D) and in the SCD (numbered as in Figure 2B) of 2C and 4C cortical neurons (F).

