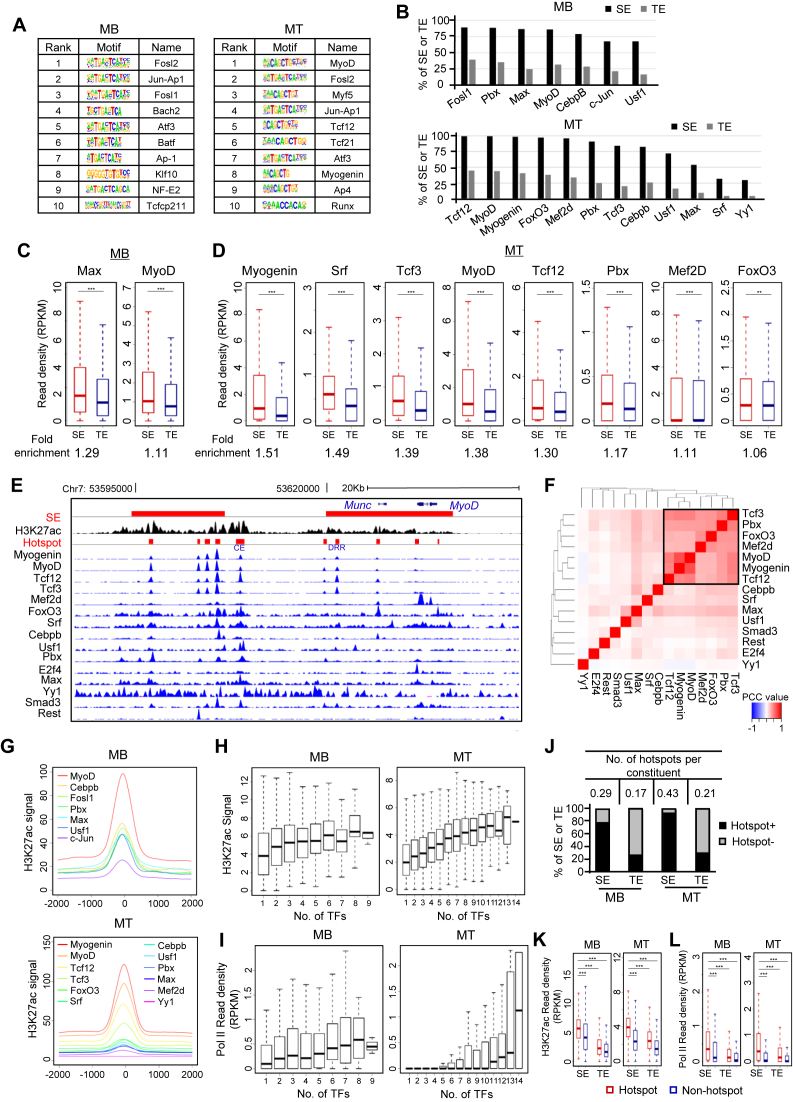
Figure 2.
Identification of TF assembly and TF hotspots. (A) In silico prediction of TF motifs within SE constituents in MB and MT identified key regulators in the respective cell stage. (B) Compared with TEs, a larger percentage of SEs are occupied by the indicated TFs by analyzing available ChIP-seq datasets. (C and D) TFs showed higher read density at SEs than TEs in both MB and MT. ChIP-seq read density at each SE or TE constituents extended by 100 bp on both sides was calculated. Fold-enrichment below each plot was calculated as the ratio of the mean value between the read density at SE and TE constituents. *P < 0.05, **P < 0.01 and ***P < 0.001. (E) Genome browser snapshot to show co-localization of TFs on the two SEs (red bars) associated with MyoD locus. (F) Analysis for TF co-association in MT. A combinational module was identified in the square. The color code indicates the PCC between two TFs at their binding sites. (G) Metagene plots were generated to show the TFs cobound to proximal genomic loci. (H and I) Enhancer activity elevates with the increasing number of binding TFs as measured by H3K27ac signal or Pol II read density. (J) SEs are more enriched with TF hotspots compared with TEs. Y-axis represents the percentage of SEs or TEs harboring at least one hotspot (Hotspot+) or no hotspot (Hotspot−). The number of hotspots per enhancer constituent was calculated (Table on top). (K and L) Hotspot regions showed significantly higher level of H3K27ac or Pol II density compared to non-hotspot genomic loci. ***P < 0.001.

