Figure 5.
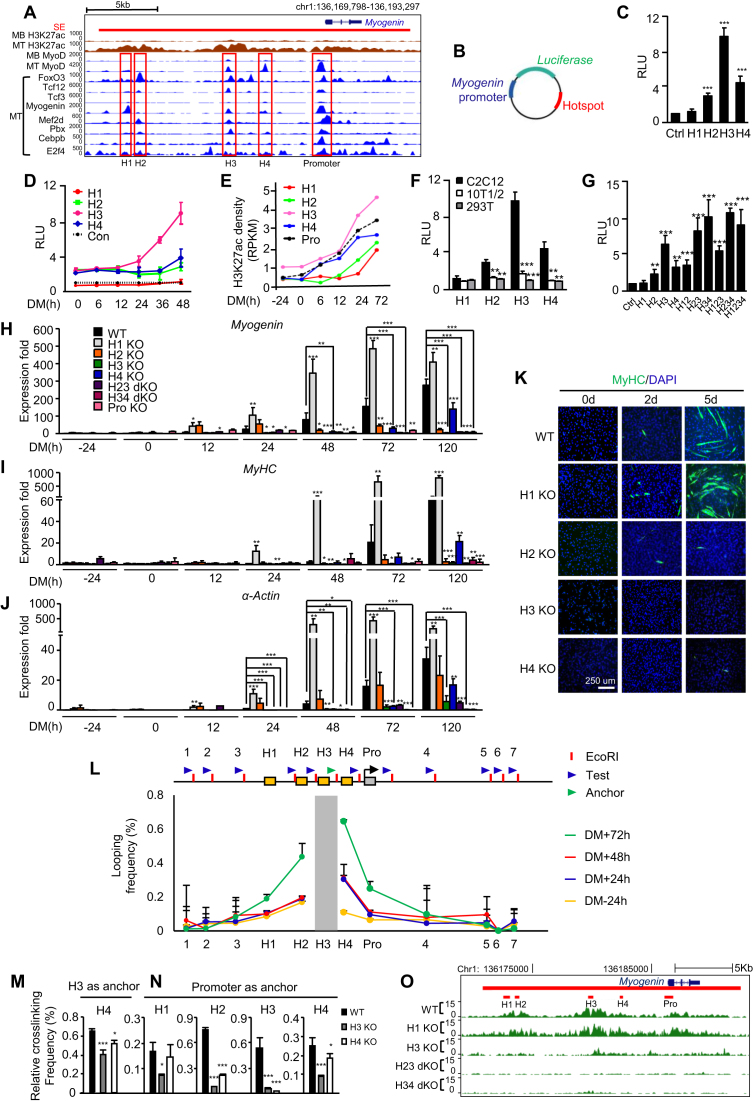
Dynamic and hierarchical cooperation among hotspots governs Myogenin gene induction during differentiation. (A) ChIP-seq profiles for across the Myogenin locus in C2C12 MB or MT. The SE is shown as red bar. Four non-promoter hotspots and one promoter hotspot are highlighted in red rectangles. (B) Diagram of the plasmid constructed for luciferase reporter assays. The Myogenin minimal promoter (blue) was inserted upstream while individual hotspot (red) was inserted downstream of the luciferase gene (green). (C) The above reporter was transfected into C2C12 for 24 hr before the cells were switched to DM for 48 h and measured for the luciferase activity. The plasmid containing the minimal promoter was used as control (Ctrl). RLU: relative luciferase unit. (D) Temporal dynamics of the reporter activity during C2C12 differentiation was measured at various time points. (E) Quantification of H3K27ac ChIP-seq density at each hotspot and the promoter region. (F) The hotspot activity was measured in 10T1/2 or HEK293T cells to compare with C2C12. (G) Reporters with various combinations of hotspots were generated and the activities were measured. (H) Each hotspot alone or in combination was removed by CRISPR-Cas9 and the expression of Myogenin was measured at various time points. (I and J) The degree of differentiation was measured by the expression of MyHC and α-Actin markers and (K) the staining for MyHC by immunofluorescence. (L) A schematic of the Myogenin locus illustrating hotspots H1–4 (yellow boxes), the promoter (gray box), three upstream and four downstream control loci (1–7). Blue arrow heads indicate 3C primers designed at EcoRI sites (red bar) for each test region, while green arrow head indicates anchor primer for H3 region. Quantitative 3C-qPCRs were performed using the anchor and each primer to test the interaction between H3 (the anchor region, gray bar) and the test region. The looping frequency (%) was obtained by normalizing to the control BAC template. (M) The interaction between H3 and H4 in H3 or H4 KO was assessed by 3C-qPCR. (N) The interaction between each hotspot and the promoter was assessed by 3C-PCR in H3 or H4 KO cells. (O) H3K27ac ChIP-seq experiments were performed to measure the effect of hotspot deletion on the SE activity. All luciferase data represent the average of three independent experiments ± s.d. All qRT-PCR and ChIP-PCR data were normalized to GAPDH mRNA or ChIP input respectively and represent the average of three independent experiments ±s.d. *P < 0.05, **P < 0.01 and ***P < 0.001.

