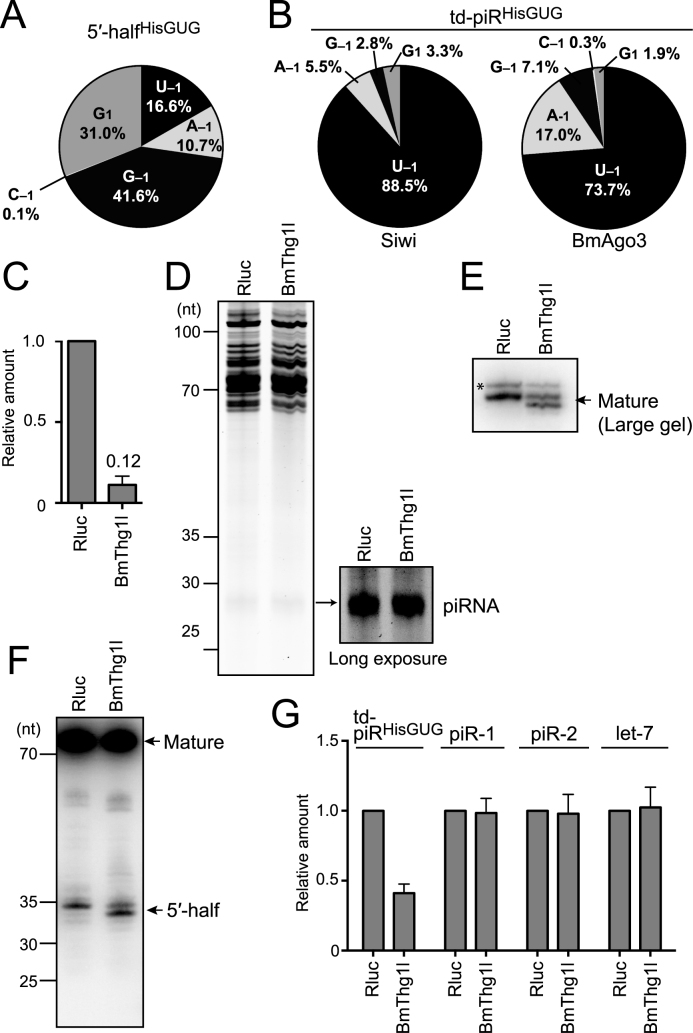
Figure 4.
Analyses of tRNAHisGUG and td-piRHisGUG in BmThg1l-depleted BmN4 cells. (A) Pie chart showing the 5′-terminal variations of BmN4 5′-halfHisGUG identified by cP-RNA-seq. (B) Pie charts showing the 5′-terminal variations of BmN4 td-piRHisGUG bound to Siwi and BmAgo3. (C) BmThg1l mRNA from BmN4 cells treated with dsRNAs targeting Renilla luciferase (Rluc, negative control) or BmThg1l was quantified by qRT-PCR. Each data set represents the average of three independent experiments with bars showing the SD. (D) Total RNA from Rluc- or BmThg1l-depleted cells was subjected to denaturing PAGE and stained by SYBR Gold. Long exposure enabled clear observation of the piRNA bands. (E, F) Total RNA from Rluc- or BmThg1l-depleted cells was subjected to Northern blot targeting the 5′-part of tRNAHisGUG using a large-size gel with 1 nt resolution for mature tRNA (E) or a standard-size gel for its 5′-half (F). Because the 5′-part of the tRNA is targeted, both mature tRNAHisGUG and 5′-halfHisGUG were detected. td-piRHisGUG was not detected due to a lack of sensitivity. For both mature tRNA and 5′-half, a band with slightly smaller size appeared upon BmThg1l-depletion, suggesting the role of BmThg1l in the –1 nucleotide addition to tRNAHisGUG. Bands shown with an asterisk might be non-specific as they seemed unaffected by the BmThg1l depletion. (G) The indicated piRNAs and let-7 miRNA in the Rluc- or BmThg1l-depleted cells were quantified by TaqMan qRT-PCR (Supplementary Figure S1) or qRT-PCR using a stem-loop primer. The amounts in Rluc-depleted cells were set as 1, and relative amounts are indicated. Averages of three independent experiments with SD values are shown.

