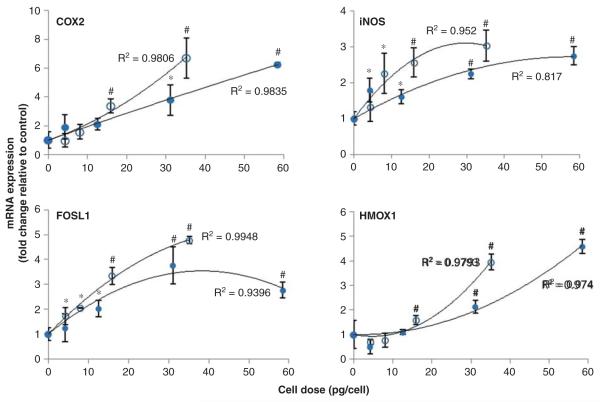
Figure 5.
Dose–response profiles for stress-related gene induction. Expression of genes associated with oxidative stress response pathways were determined by qRT-PCR after 4 h exposure of cells to varying concentrations of C442S (○) and C442L (•) agglomerates of carboxylated IONPs. The change in mRNA levels relative to untreated controls is shown as a function of mass cell dose, as determined by magnetic particle detection. Exposure concentrations (μg/ml) for these dose equivalents were 10, 25, 50 and 100 μg/ml. Solid lines represent a second order polynomial fit to the data. *p < 0.05, #p < 0.01 compared with untreated control.

