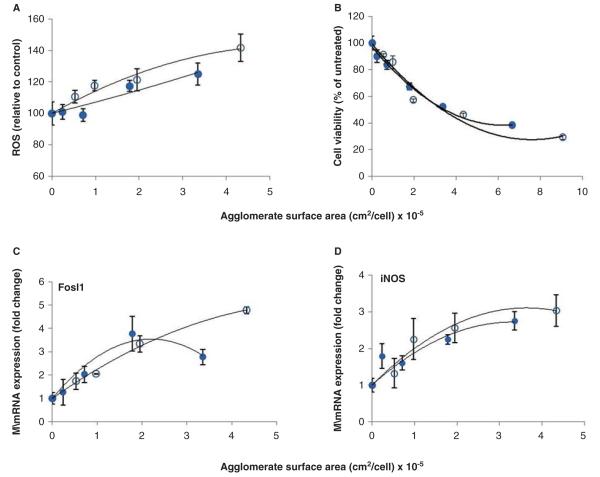
Figure 7.
Dose–response profiles for IONP agglomerates based on cellular surface area dose. Agglomerate surface area was calculated using fractal dimension (DF) values for agglomerates as identified from simulations. On a surface area metric basis, C442S (○) and C442L (•) caused equivalent levels of oxidative stress (A), cytotoxicity (B) measured at 24 h, and stress gene induction (C, D) measured at 4 h. Solid lines represent a second order polynomial fit to the data.

