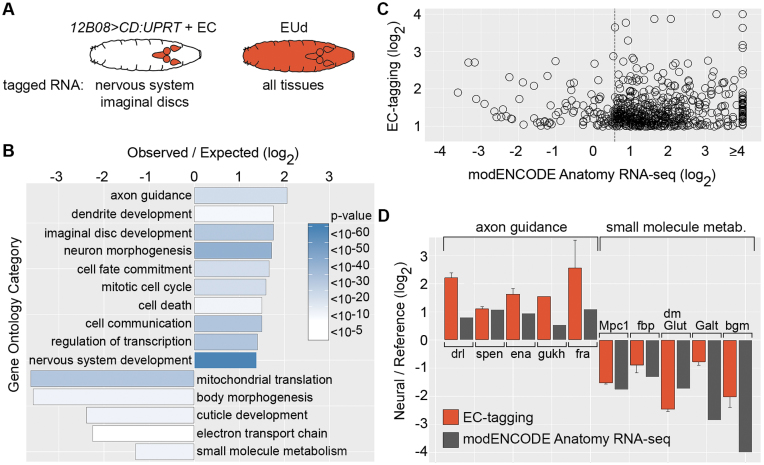
Figure 4.
Comparison of EC-tagging and dissection-based transcriptome profiling. (A) Expected specificity of RNA tagging in 12B08 > CD:UPRT larvae fed 5EC versus larvae fed 5EUd. (B) GO categories over-represented among 12B08 EU-RNA enriched and depleted genes. Observed/expected value = frequency of category genes in 12B08 EU-RNA/frequency in the Drosophila genome for the 1279 genes enriched in 12B08 EU-RNA (plotted as positive values) and the 405 genes depleted in 12B08 EU-RNA (plotted as negative values). Heatmap = Bonferroni-corrected P-values. (C) Relative expression levels for 609 genes enriched ≥2-fold in 12B08 EU-RNA with corresponding modENCODE Anatomy RNA-seq data. 12B08/whole larvae EU-RNA ratios are plotted on the y-axis and modENCODE CNS/carcass or imaginal disc/carcass ratios (the tissue with the highest RNA-seq expression level was selected) is plotted on the x-axis. The dashed line indicates 1.5-fold enrichment in the modENCODE data. (D) 12B08/whole larvae EU-RNA values (EC-tagging) and modENCODE Anatomy RNA-seq CNS/carcass (axon guidance category) or CNS/digestive system (small molecule metabolism category) ratios are shown as ‘Neural/Reference’ values (y-axis). EC-tagging data are the average and standard error of the mean for multiple measurements across replicate microarrays.

