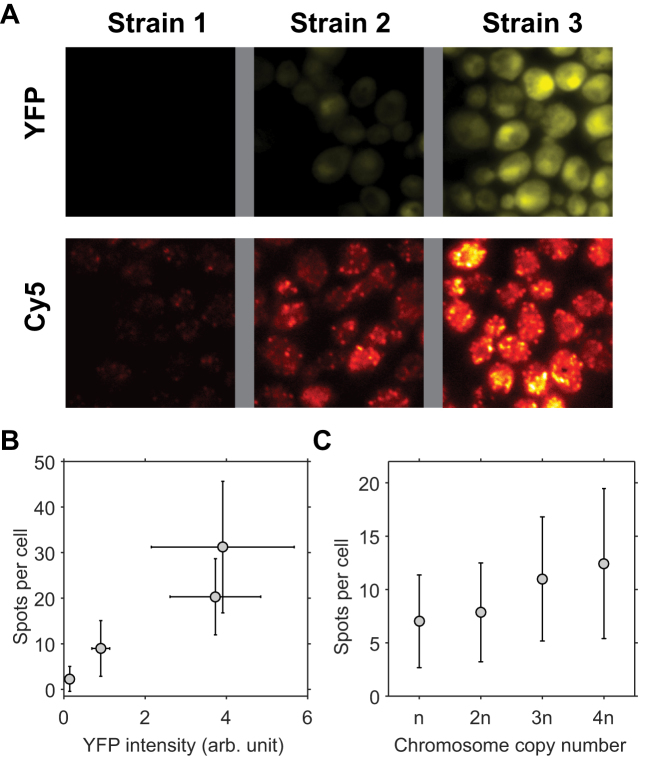
Figure 2.
Correlation between sFISH spots and protein expression level. (A) Fluorescence images of single yeast cells expressing YFP (top row) and sFISH signals from Cy5-labeled probes targeting YFP mRNA (bottom row). Shown from left to right are fluorescence images of the negative control (no YFP expression), low YFP expression, and high YFP expression. Fluorescence intensities in the YFP channel and Cy5 channel are represented by false yellow and red colors, respectively. YFP images are from formaldehyde fixed cells, and Cy5 sFISH images are from methanol fixed cells. (B) Correlation plot. The mean number of FISH spots is plotted versus the mean yEVenus expression level. The error bars are measures of the standard deviation. (C) sFISH spots versus ploidy. sFISH was performed on yeast strains with four different ploidies (1n, 2n, 3n, 4n). The error bars show the standard deviation of the data. The number of spots detected per cell increases monotonically with the number of copies.

