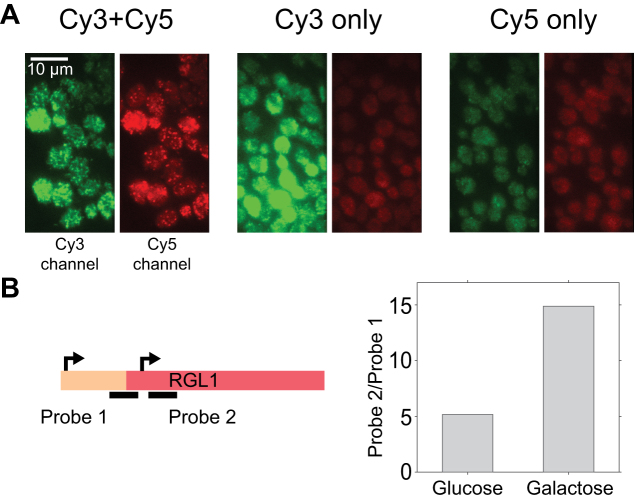
Figure 5.
Applications of sFISH. (A) Demonstration of FRET-FISH in yeast. Fluorescence image acquired under 532-nm excitation was split into two half images based on the emission wavelength. In each image, the green half on the left is from the Cy3 emission channel, and the red half on the right is from the Cy5 emission channel. The images shown represent cells treated with both Cy3- and Cy5-probes (left), Cy3-probe only (middle), and Cy5-probe only (right). Bright, punctate spots were observed in the Cy5 channel only when cells were treated with both probes (left). (B) sFISH for mRNA isoform detection. The schematic on the left depicts alternative transcription initiation sites (arrows) at the RGL1 locus, which lead to mRNA isoforms with different lengths. Transcription from the first site produces a full-length mRNA, while from the second site produces a truncated isoform. Using sFISH with two separate probes, the relative fractions of these isoforms can be measured. Probe 1 targets the longer isoform only, whereas probe 2 targets both. The bar plot on the right shows the ratio of sFISH signals with probe 2 to probe 1 measured with glucose (left) or galactose (right) growth media. Here, the mean total fluorescence intensity per cell was used as a proxy for sFISH signal because transcription level was too high to count individual spots.

