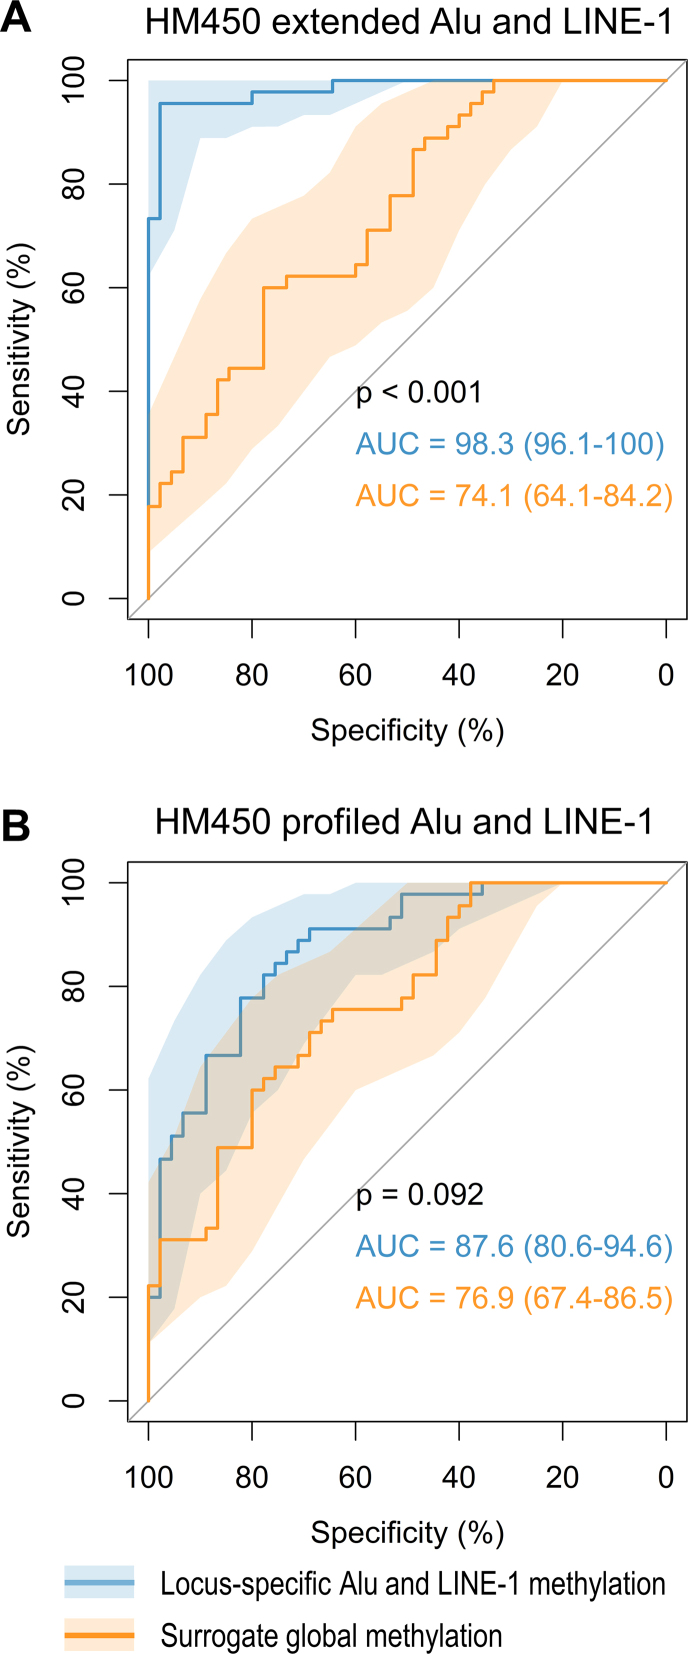
Figure 8.
Discrimination power of locus-specific Alu/LINE-1 methylation vs surrogate global methylation. (A) extended Alu and LINE-1 methylation. (B) Profiled only. Shaded regions represent 95% confidence intervals of ROC curves. Locus-specific Alu and LINE-1 methylation achieved higher AUC than that using surrogate global methylation. Our predicted methylation achieved higher AUC than that using HM450-profiled methylation.

