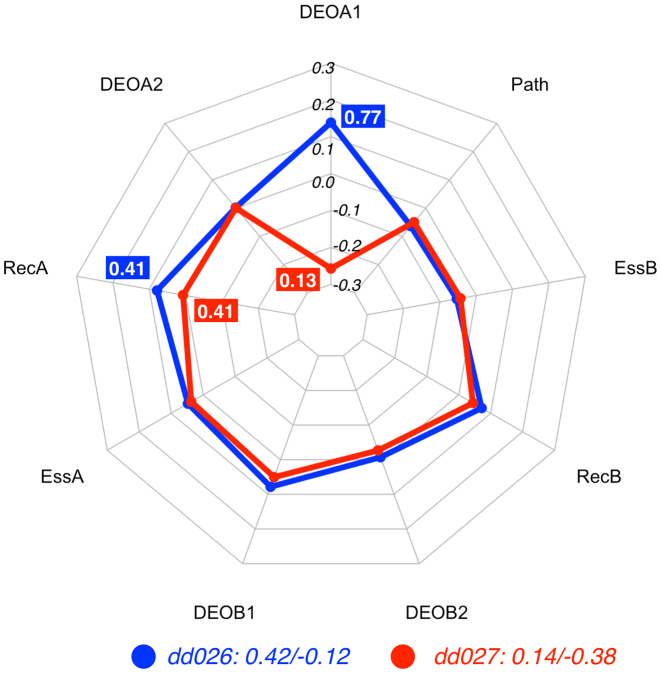
Figure 3.
Radar plot of the DE profiles for the digenic combinations dd026 (CO) and dd027 (TD), two instances related to autosomal glaucoma. The feature vectors of both digenic combinations are identical except for the DEOA1 score, making it the feature that decides to which class either instance is assigned : with all other features being equal, the high DEOA1 value (0.77 as opposed to 0.13) leads the DE predictor to decide in favour of the CO class. The plot also shows also that even when values in the feature vector x are identical the contributions contribn(x) may be different, as can be seen for the RecA feature. Feature vectors and corresponding decision vectors for dd026 and dd027 are available in Supplementary Material (Table S2 and Table S3).

